
Highlights
- The stock declined sharply and continues to trade well below its 50-day average.
- RSI has entered deeply oversold territory, reflecting stretched downside momentum.
- Support and resistance levels indicate pressure persists despite potential short-term bounce.
Vasa Denticity Limited (NSE:DENTALKART) traded near ₹ 332.50 on March 25, 2026, declining around 15.82% during the session. The stock remains significantly below its 50-day Simple Moving Average near ₹ 498.20, indicating a weak broader technical structure.
The price action reflects a sharp and extended downtrend, with consistent selling pressure pushing the stock toward lower levels. The absence of sustained upward movement suggests that the current trend remains dominated by sellers, with limited signs of reversal so far.
Momentum Indicators Signal Oversold Conditions
The 14-day Relative Strength Index (RSI) is positioned near 23.72, placing it firmly in the oversold zone. This indicates that the stock has experienced strong downward momentum over recent sessions.
While such low RSI levels can sometimes lead to short-term technical rebounds, they also reflect continued weakness unless supported by sustained buying interest. The current reading highlights stretched conditions but does not confirm a reversal.
Key Support and Resistance Levels
Vasa Denticity Limited (NSE:DENTALKART) is currently trading near ₹332.50 as of March 25, 2026, declining around 15.82%, and remains well below its 50-day Simple Moving Average near ₹498.20, indicating a weak broader setup.
The price action reflects a sharp and extended decline, with the latest move showing continued pressure toward lower levels. The 14-day RSI near 23.72 indicates deeply oversold conditions, suggesting stretched momentum on the downside. In the near term, support is placed around ₹300.00–₹270.00, while resistance is seen near ₹380.00–₹420.00.
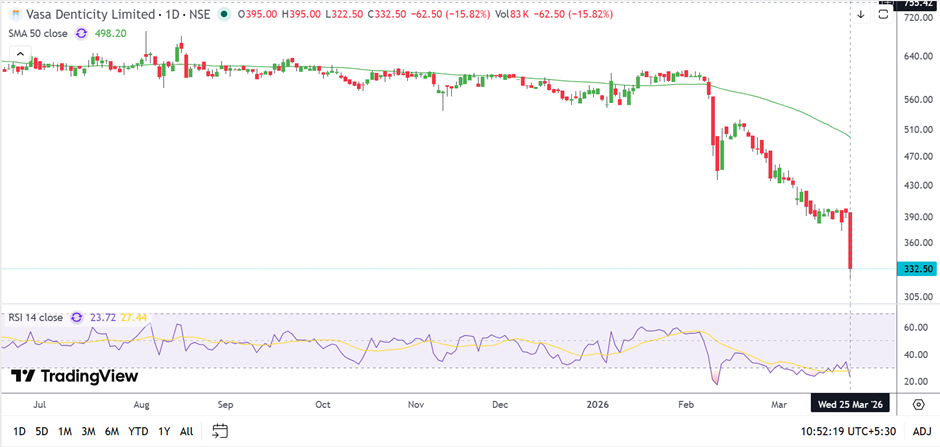
Source: TradingView
Key Risks
- Prolonged downtrend may continue if selling pressure remains elevated.
- Deeply oversold RSI may not immediately translate into a sustained recovery.
- Failure to hold support levels could trigger further downside movement.
- Trading below key moving averages indicates weak overall technical structure.
Summary
Vasa Denticity stock remains under significant pressure, trading well below its 50-day moving average after a sharp decline. RSI levels indicate deeply oversold conditions, reflecting strong downside momentum. While short-term rebounds are possible, the broader trend remains weak. Key support and resistance zones will be crucial in determining whether the stock stabilises or continues its downward trajectory.
FAQs
- What is the current trend of Vasa Denticity stock?
The stock is in a strong downtrend, trading significantly below key moving averages. - What does the RSI level indicate?
RSI near 24 shows deeply oversold conditions, indicating strong recent selling pressure. - What are the key support and resistance levels?
Support lies between ₹ 300–270, while resistance is seen in the ₹ 380–420 range.