
Highlights
- Wealth First Portfolio Managers shares surged nearly 15% during Thursday’s trading session.
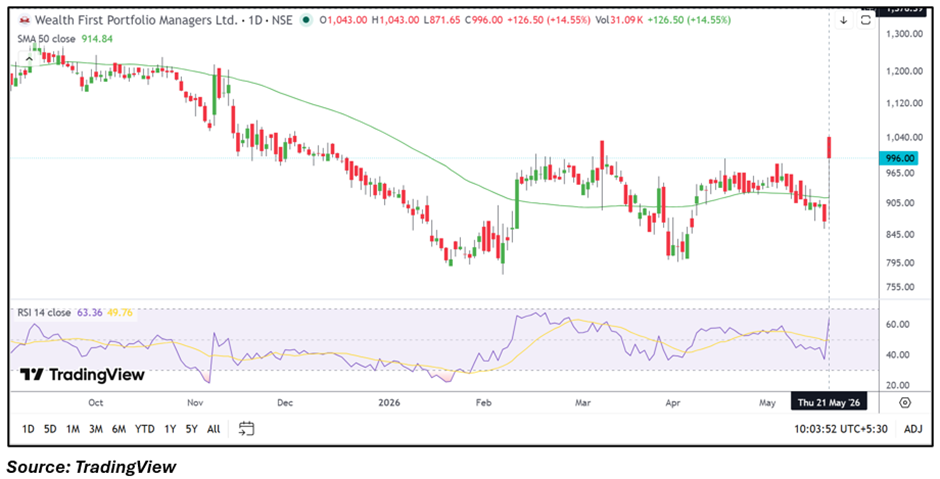
- The stock moved sharply above its 50-day SMA amid renewed momentum activity.
- RSI indicator strengthened significantly, reflecting improving short-term price momentum.
Overview
Wealth First Portfolio Managers Limited shares witnessed a sharp rally on May 21, with the stock climbing nearly 15% intraday to around ₹1,000. The counter also entered the list of top market gainers during the session.
The sharp upside move came alongside increased volatility and improved momentum readings on the charts. The stock opened significantly higher at ₹1,043 before witnessing intraday swings, while trading volumes also remained elevated compared to recent sessions.
Wealth First Portfolio Managers had earlier reported standalone quarterly numbers for the December 2025 quarter. The company posted total income of ₹619.04 lakh, profit before tax of ₹195.76 lakh, and net profit of ₹138.49 lakh. Earnings per share stood at ₹1.30.
Fundamental View
The stock remains a closely tracked small-cap counter in the financial services segment. Recent market activity indicates renewed trader interest amid improving technical structure and sharp price recovery from recent lows.
Investors are also monitoring broader sentiment in wealth management and financial service-related counters, where selective momentum-based buying has emerged in recent sessions.
Technical View
Wealth First Portfolio Managers stock is currently trading near ₹1,000 and has moved above its 50-day SMA placed around ₹914.84, reflecting improvement in the near-term trend structure. Recent price action indicates a strong breakout attempt after the stock consolidated around the ₹860–₹930 zone over the past few weeks.
The 14-day RSI has climbed near 63.36, suggesting strengthening momentum conditions. The momentum oscillator indicates improving bullish price strength after remaining range-bound for several sessions. However, the sharp intraday volatility also suggests traders may continue reacting aggressively near key resistance zones.
Key Technical Levels
On the downside, immediate support is placed in the ₹930–₹890 region, which could remain important if profit-booking emerges after the sharp rally. On the upside, resistance is seen near ₹1,100–₹1,145, where traders may watch for further breakout confirmation.
Risks to Watch
- Sharp price swings may increase short-term volatility risks.
- Low trading participation can amplify sudden price movements.
- Profit-booking near resistance zones may limit upside momentum.
- Broader market weakness could affect sentiment in small-cap counters.
Summary
Wealth First Portfolio Managers shares surged nearly 15% as momentum indicators improved and the stock crossed above its 50-day SMA. The RSI has also strengthened, reflecting improving near-term momentum conditions. Traders are now watching whether the stock can sustain above the ₹930 support zone while attempting a move toward the ₹1,100–₹1,145 resistance region.
FAQs
- Why did Wealth First Portfolio Managers shares surge today?
The stock rallied sharply amid renewed momentum activity and improving technical structure during Thursday’s trading session. - What are the key support levels for WEALTH stock?
Immediate support is placed near ₹930, followed by a broader support zone around ₹890. - What does the RSI indicate for Wealth First Portfolio Managers shares?
The RSI near 63 indicates improving momentum conditions with strengthening short-term price action.