
Highlights
- The stock surged 20% to hit the upper circuit limit.
- Short-term returns significantly outperformed NIFTY 50 benchmark.
- Technical indicators indicate strong momentum with overbought signals.
Shares of Hindustan Composites Limited (NSE:HINDCOMPOS) were trading at ₹491.80 as of April 15, 2026, registering a gain of ₹81.95 or 20.00%, hitting the upper circuit. The stock opened at ₹448.00 and moved to an intraday high of ₹491.80, while the low stood at ₹440.00, indicating sustained buying interest during the session.
The previous close was ₹409.85, and the VWAP stood at ₹488.59. The stock has featured among the top gainers, supported by strong upward momentum.
Returns Compared to Benchmark
Hindustan Composites Limited has delivered higher returns compared to the NIFTY 50 across multiple timeframes. Over the past week, the stock gained 22.93% compared to 0.93% for the index.
Monthly returns stand at 27.26%, significantly higher than the index return of 4.62%. On a year-to-date basis, the stock gained 15.51%, while the benchmark declined 7.37%.
Over a one-year period, returns stand at 13.17%, compared to 3.82% for the index. Long-term performance remains higher, with 3-year returns at 80.28% versus 35.86%, and 5-year returns at 87.25% compared to 66.10% for the index.
Financial Performance Snapshot
For the quarter ended December 31, 2025, consolidated total income stood at ₹9,451.00 lakh. Profit before tax was ₹887.00 lakh, while net profit came in at ₹667.00 lakh. Earnings per share (EPS) was ₹4.52.
Standalone financials reflect similar figures, indicating aligned operations across segments. These results are based on unaudited financial data released in February 2026.
Technical Indicators and Momentum
The stock has moved sharply above its 21-day simple moving average near ₹387.59, indicating a strong breakout. It rebounded from recent lows around ₹349.00, initiating a rapid upward move.
The 14-day RSI stands at 73.39, placing it in the overbought zone and reflecting strong momentum. Immediate support is seen in the ₹440-395 range, while resistance is observed near ₹550-600 levels.
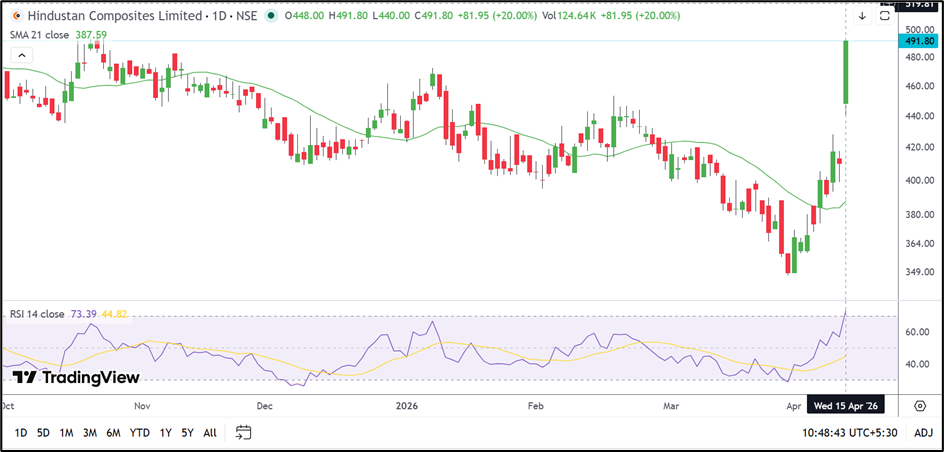
Source:TradingView
Trading and Volatility Indicators
The company has a total market capitalisation of ₹726.34 crore and a free float market cap of ₹158.94 crore. Traded volume during the session was 1.42 lakh shares, translating into a traded value of ₹6.95 crore.
Impact cost stands at 0.59, indicating moderate liquidity. Daily volatility is recorded at 2.40%, while annualised volatility stands at 45.85%, reflecting notable price fluctuations.
The deliverable quantity stands at 26.95% of traded volume, indicating a mix of delivery-based and intraday trading activity.
Key Risks
- Overbought technical indicators may lead to short-term correction.
- Low investor participation indicated by limited PAN activity.
- Moderate liquidity may impact price stability.
- High volatility may result in sharp price swings.
Summary
Hindustan Composites Limited shares surged to hit the upper circuit, supported by strong short-term momentum and a technical breakout above key levels. The stock has outperformed the NIFTY 50 across multiple timeframes. Financial results indicate reported income and profitability. Technical indicators suggest elevated momentum, while liquidity and volatility remain important considerations.
FAQs
- Why did Hindustan Composites stock hit the upper circuit?
The stock surged 20% due to strong buying momentum and a breakout above key technical levels. - What do technical indicators suggest for the stock?
Indicators show overbought conditions with strong momentum, suggesting possible short-term consolidation or pullback. - How has Hindustan Composites performed compared to NIFTY 50?
It has outperformed across short-term and long-term periods compared to the benchmark index.