
Highlights
- The stock surged 20% to hit the upper circuit limit.
- Short-term returns significantly outperformed NIFTY 50 benchmark.
- Technical indicators signal strong momentum with near overbought levels.
Shares of Elgi Rubber Company Limited (NSE:ELGIRUBCO) were trading at ₹48.97 as of April 15, 2026, registering a sharp gain of ₹8.16 or 20.00%, hitting the upper circuit. The stock opened at ₹42.60 and touched a high of ₹48.97, while the low stood at ₹40.81, indicating strong buying interest throughout the session.
The previous close was ₹40.81, and the VWAP stood at ₹47.58. The stock has featured among the top gainers of the day, supported by strong price momentum.
Returns Compared to Benchmark
Elgi Rubber Company Limited has delivered higher returns than the NIFTY 50 in the short term. Over the past week, the stock gained 16.90% compared to 0.84% for the index.
Monthly returns stand at 26.83%, significantly above the index return of 4.52%. On a year-to-date basis, the stock gained 7.34%, while the benchmark declined 7.45%.
However, one-year performance shows a decline of 17.36%, compared to a gain of 3.73% in the index. Over longer periods, returns are relatively aligned, with 3-year returns at 40.52% versus 35.73%, and 5-year returns at 82.38% compared to 65.95% for the index.
Technical Indicators and Momentum
The stock has moved above its 21-day simple moving average near ₹39.38, indicating a breakout from recent consolidation levels. It has recovered from recent lows around ₹33.00, showing a strong upward trend.
The 14-day RSI stands near 68.96, approaching overbought territory. This suggests strong momentum, though it may also indicate the possibility of a near-term consolidation or pullback.
Immediate support is seen in the ₹43-39 range, while resistance is observed near ₹53-60 levels.
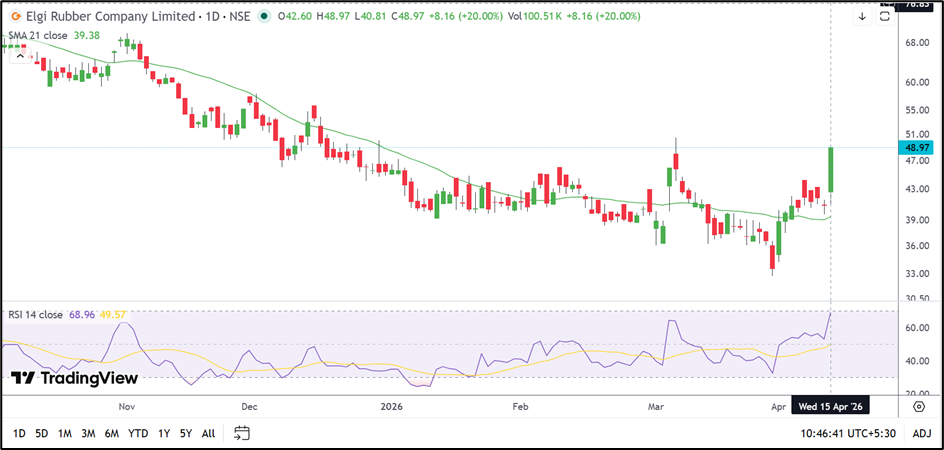
Source: TradingView
Trading and Volatility Indicators
The company has a total market capitalisation of ₹245.09 crore and a free float market cap of ₹76.40 crore. Traded volume during the session was 1.10 lakh shares, translating into a traded value of ₹0.52 crore.
Impact cost stands at 1.29, indicating relatively low liquidity. Daily volatility is recorded at 3.71%, while annualised volatility stands at 70.88%, reflecting sharp price fluctuations. The deliverable quantity is high at 88.88% of traded volume, indicating strong delivery-based participation.
Key Risks
- High volatility may result in sharp price fluctuations.
- Low liquidity indicated by high impact cost may affect trading.
- Overbought technical indicators may lead to short-term corrections.
- One-year negative returns indicate inconsistent long-term performance.
Summary
Elgi Rubber Company Limited shares surged to hit the upper circuit, supported by strong short-term momentum and technical breakout above key levels. The stock has outperformed the NIFTY 50 in recent periods, although one-year returns remain negative. Technical indicators suggest strong momentum with potential for near-term consolidation. Liquidity and volatility remain important considerations.
FAQs
- Why did Elgi Rubber stock hit the upper circuit?
The stock surged 20% due to strong buying momentum and technical breakout above key moving averages. - What do technical indicators suggest for Elgi Rubber stock?
Indicators show strong momentum with RSI near overbought levels, suggesting possible short-term consolidation or pullback. - How has Elgi Rubber performed compared to NIFTY 50?
It outperformed in the short term but underperformed over the one-year period compared to the index.