
Highlights
- The stock declined nearly 5% despite maintaining recovery trend.
- Short-term returns outperformed NIFTY 50 benchmark.
- Technical indicators suggest improving sentiment with moderate momentum.
Shares of Blue Coast Hotels Limited (NSE:BLUECOAST) were trading near ₹23.41, reflecting a decline of around 4.91% during the session. The stock opened at ₹25.23 compared to the previous close of ₹24.62 and touched an intraday high of ₹25.23, while the low stood at ₹23.30.
The VWAP stood at ₹24.20, indicating trading activity slightly above current levels. The stock has shown signs of consolidation following recent upward movement.
Returns Compared to Benchmark
Blue Coast Hotels Limited has delivered higher returns than the NIFTY 50 in the short term. Over the past week, the stock gained 12.03%, compared to 0.90% for the index.
Monthly returns stand at 19.81%, significantly higher than the index return of 4.59%. However, on a year-to-date basis, the stock declined 27.29%, compared to a fall of 7.40% in the benchmark.
Over a one-year period, the stock declined 7.76%, while the index gained 3.79%. Long-term return data remains limited.
Financial Performance Snapshot
For the quarter ended December 31, 2025, consolidated total income stood at ₹46.67 lakh. The company reported a loss, with profit before tax at ₹-37.72 lakh and net loss at ₹-37.72 lakh. Earnings per share (EPS) stood at ₹-0.15.
Standalone financials reflect similar figures, with total income at ₹46.67 lakh and net loss at ₹-37.32 lakh.These results are based on unaudited financial disclosures released in February 2026.
Technical Summary
Blue Coast Hotels is trading near ₹23.41, down around 4.91%, but maintains its position above the 21-day SMA near ₹20.94, indicating a nascent recovery phase. The recent breakout from a long-term downtrend suggests shifting sentiment, supported by an RSI near 58.95, showing positive momentum. Immediate support is seen in the ₹19.50–21.00 zone, while resistance is anticipated near the ₹27.00–30.00 range.
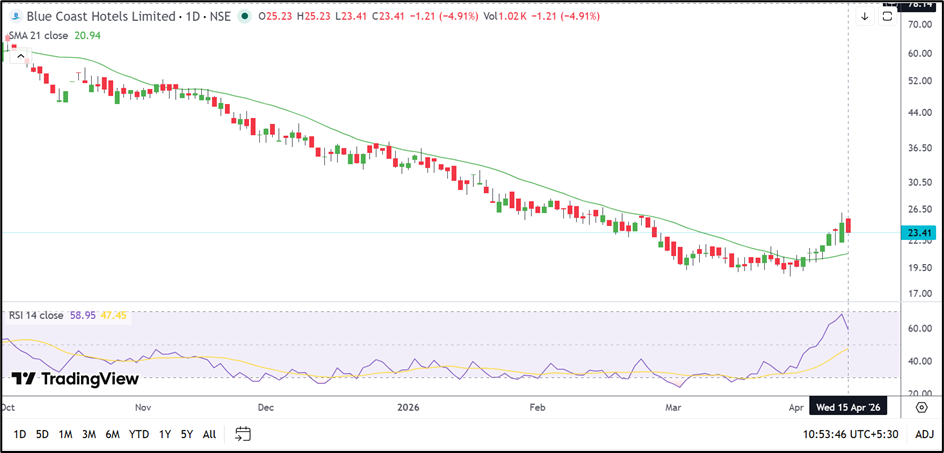
Source: TradingView
Trading and Volatility Indicators
The company has a total market capitalisation of ₹42.10 crore and a free float market cap of ₹12.05 crore. Traded volume during the session was 0.02 lakh shares, translating into a traded value of ₹0.01 crore.
Impact cost stands at 4.97, indicating low liquidity. Daily volatility is recorded at 5.52%, while annualised volatility stands at 105.46%, reflecting very high price fluctuations.
The deliverable quantity stands at 83.12% of traded volume, indicating high delivery-based participation.
Key Risks
- Low liquidity may impact ease of trading positions.
- Continued losses indicate financial instability.
- High volatility may result in sharp price swings.
- Weak long-term returns indicate inconsistent performance.
Summary
Blue Coast Hotels Limited shares declined during the session but continue to trade above key support levels, indicating a potential recovery phase. Short-term returns have outperformed the benchmark, while financials reflect ongoing losses. Technical indicators suggest improving sentiment with moderate momentum. Liquidity and volatility remain key factors influencing price movement.
FAQs
- Why did Blue Coast Hotels stock decline today?
The stock fell due to short-term selling pressure after recent gains despite maintaining a recovery trend. - What do technical indicators suggest for Blue Coast Hotels stock?
RSI indicates positive momentum, with support near ₹19.5–₹21 and resistance around ₹27–₹30 levels. - What are the key concerns for Blue Coast Hotels?
Key concerns include low liquidity, ongoing losses, high volatility, and weak long-term performance.