
Highlights
- Sarthak Metals stock declined during March 30, 2026 trading session.
- Price moved close to 52-week low with elevated volatility levels.
- Recent financials show profitability with moderate earnings per share.
Sarthak Metals (NSE:SMLT) recorded a notable decline on March 30, 2026. The stock traded at ₹ 57.95, down ₹ 5.81 or 9.11%. The stock opened at ₹ 63.76 and touched a high of ₹ 65.19, before falling to a low of ₹ 57.36, which also marks its 52-week low. The previous close stood at ₹ 63.76, while VWAP was recorded at ₹ 59.83.
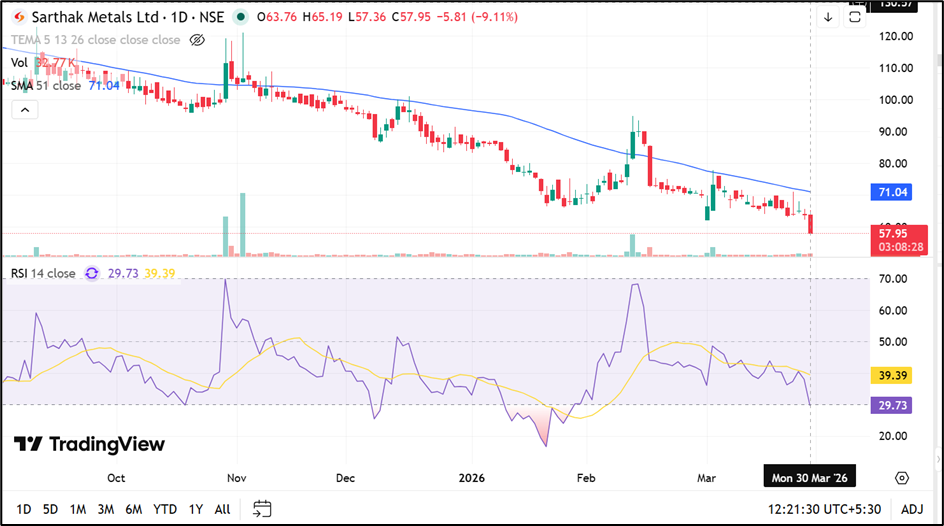
Source: TradingView
Volatility and Price Indicators
The stock has shown elevated volatility, with daily volatility at 3.27 and annualised volatility at 62.47. The price band is set at 20%, with an upper band of ₹ 76.51 and a lower band of ₹ 51.01.
The current price is significantly below the 52-week high of ₹ 140.00 recorded on June 3, 2025, indicating a wide price range over the past year.
Financial Performance Snapshot
For the quarter ended December 31, 2025, the company reported total income of ₹ 4,822.36 lakh on a standalone basis.
Profit before tax stood at ₹ 179.18 lakh, while net profit was reported at ₹ 129.72 lakh. Earnings per share (EPS) for the quarter was ₹ 0.95. The financial results were disclosed on February 10, 2026.
Earnings and Profitability Context
The company reported profitability during the quarter, with moderate earnings relative to revenue. EPS indicates earnings generation, though market price movement reflects broader trading dynamics. Profitability levels remain a key metric alongside volatility indicators and price trends.
Price Trend and Market Behavior
The stock has declined toward the lower end of its annual trading range. The movement from ₹ 140.00 high to current levels highlights a broad price correction over time. Intraday movement shows a sharp decline from opening levels, reflecting active trading within defined circuit limits.
Key Risks
- High volatility may lead to sharp price swings.
- Price near 52-week low indicates downward trend.
- Earnings sensitive to metal and raw material price cycles.
Summary
Sarthak Metals Limited recorded a decline on March 30, 2026, with the stock trading near its 52-week low of ₹ 57.36. The company reported total income of ₹ 4,822.36 lakh and net profit of ₹ 129.72 lakh for Q3 FY26, with EPS at ₹ 0.95. The stock remains characterized by high volatility and wide price movement over the past year.
FAQs
- What is the latest stock price movement of Sarthak Metals?
The stock declined 9.11% on March 30, 2026, trading at ₹ 57.95 during the session. - What are the recent financial results of Sarthak Metals?
The company reported ₹ 129.72 lakh net profit on ₹ 4,822.36 lakh income in Q3 FY26. - Why is the stock considered volatile?
The stock shows high annualised volatility of 62.47 with wide intraday price fluctuations.