
Highlights
- ITDC shares surged nearly 12% and featured among the day's top gainers.
- The stock broke above recent consolidation levels and moved to a fresh swing high.
- RSI jumped above 74, highlighting a significant acceleration in momentum.
Overview
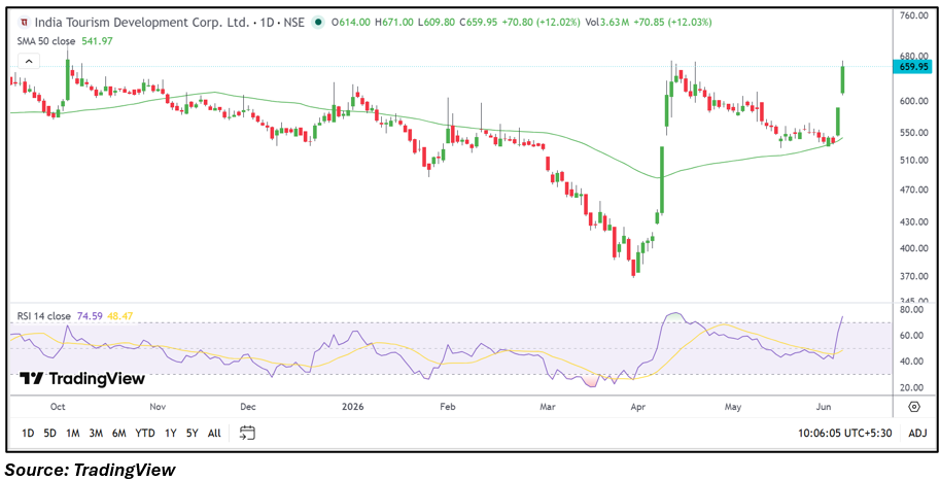
India Tourism Development Corporation (NSE: ITDC) witnessed a sharp rally on June 5, with the stock climbing 11.69% to ₹657.80. The move came after the stock broke out from a consolidation zone that had developed over the past several weeks. The rally also pushed the stock to its highest level since the strong recovery phase that began in April.
The surge has drawn attention from market participants as ITDC emerged among the top-performing stocks on the NSE during the session.
Fundamental View
ITDC reported consolidated total income of ₹15,185.00 lakh for the quarter ended March 2026. Profit before tax stood at ₹3,794.33 lakh, while net profit came in at ₹2,827.41 lakh. Earnings per share for the quarter were ₹3.30.
The latest results indicate continued profitability, although investors may continue tracking tourism demand trends, government-related initiatives, and operational performance for further cues.
Technical View
ITDC is trading at ₹657.80, comfortably above its 50-day SMA of ₹541.97, reflecting a positive near-term technical structure. On the daily chart, the stock has broken above the consolidation range that persisted through much of May and has moved close to its previous swing high zone.
The sharp expansion in price action indicates renewed momentum after several weeks of range-bound trading. The stock has also extended its recovery trend that began after the March-April rebound phase.
Momentum Indicator
The 14-day RSI has risen to approximately 74.59, moving into the overbought zone. While this reflects strong momentum, it also suggests traders may monitor for periods of consolidation following the recent sharp advance.
Key Technical Levels
On the daily chart, immediate support is seen near ₹620, which represents the recent breakout area and could act as an important demand zone. A stronger support level is placed around ₹590, where the stock consolidated before the latest surge. On the upside, the immediate resistance zone is visible near ₹671, the day's high. A sustained move above this level could open the path toward the ₹700-720 region, which would mark the next significant chart hurdle.
Risks to Watch
- Elevated valuation compared with earnings growth.
- Profit booking after the recent sharp rally.
- Volatility due to tourism sector sentiment changes.
- Failure to sustain above the breakout zone.
Summary
ITDC shares rallied sharply after breaking above a prolonged consolidation range on the daily chart. The stock remains well above its 50-day SMA, while RSI momentum has accelerated into overbought territory. The latest quarterly results showed profitability, supporting the broader recovery narrative. Going forward, investors may watch whether the stock can sustain above its breakout zone and challenge the recent swing highs.
FAQs
- Why is ITDC stock rising today?
The stock surged after breaking out of a consolidation range and moving toward a fresh swing high on the daily chart.
- What does the RSI indicate for ITDC?
The RSI is above 74, indicating strong momentum, though the stock is approaching overbought territory.
- What are the key levels to watch in ITDC?
Support is seen near ₹620 and ₹590, while resistance is located around ₹671 and then near ₹700.