
Highlights
- RSWM shares surged nearly 15% and emerged among the top gainers on the NSE.
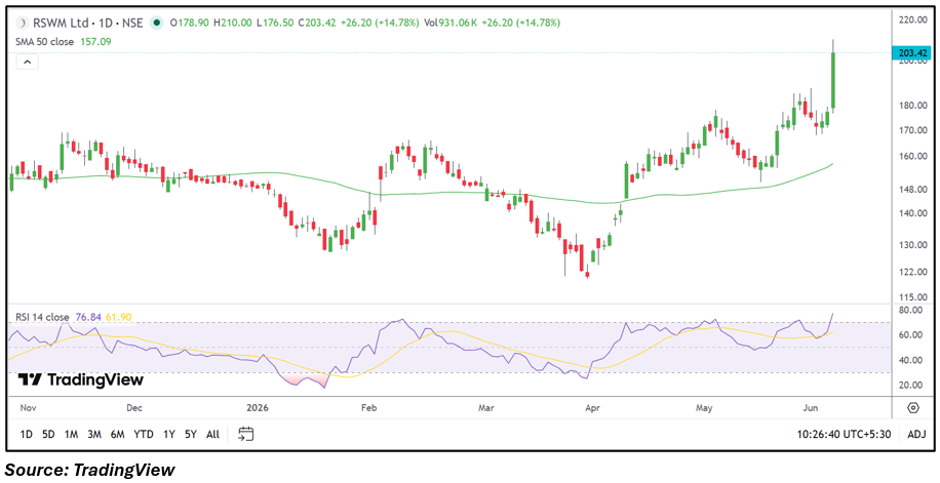
- The stock broke above the ₹180-190 consolidation zone and crossed the ₹200 mark.
- RSI moved into overbought territory, reflecting a sharp acceleration in momentum.
Overview
RSWM (NSE: RSWM) witnessed a strong rally on June 5, with the stock rising 14.92% to ₹203.67. The move pushed the stock above the psychologically important ₹200 level and extended the uptrend that has been developing since the April lows.
The rally comes amid improving technical momentum and follows a period of consolidation during May. With the stock reaching its highest level in several months, traders have increasingly focused on the sustainability of the current breakout.
Fundamental View
For the quarter ended March 2026, RSWM reported standalone total income of ₹1,15,882 lakh. Profit before tax stood at ₹1,791 lakh, while net profit came in at ₹3,455 lakh. Earnings per share for the quarter were ₹7.33.
The latest quarterly numbers indicate profitability despite continued challenges faced by the textile sector, including fluctuations in raw material costs and demand conditions across export markets.
Technical View
RSWM is trading at ₹203.67, significantly above its 50-day SMA of ₹157.09, indicating a positive near-term technical structure. The daily chart shows a decisive breakout above the recent consolidation band near ₹180-190, accompanied by a sharp expansion in price momentum.
The stock has been forming higher highs and higher lows since April, reflecting sustained upward price structure. Friday's move strengthened this trend and pushed the stock to fresh swing highs on the daily timeframe.
Momentum Indicator
The 14-day RSI has climbed to approximately 76.84, entering overbought territory. While this highlights strong momentum, it also suggests traders may watch for consolidation or volatility following the recent sharp advance.
Key Technical Levels
On the daily chart, immediate support is seen near ₹190, which represents the recent breakout zone and could act as the first area of demand during any pullback. A stronger support level is placed around ₹177, near the previous consolidation range. On the upside, immediate resistance is visible near ₹210, which marks the day's high. If the stock manages to sustain above ₹210, the next resistance zone could emerge around ₹225 based on the current price structure.
Risks to Watch
- Profit booking after the recent sharp rally.
- Overbought RSI conditions may trigger short-term volatility.
- Weakness in textile demand could affect earnings.
- Failure to hold above the breakout zone may weaken momentum.
Summary
RSWM shares surged after breaking above a key consolidation range and crossing the ₹200 mark on the daily chart. The stock remains well above its 50-day SMA, while RSI has entered overbought territory, highlighting strong momentum. The latest quarterly results showed profitability, supporting investor interest. Going forward, traders may focus on whether the stock can sustain above the breakout area and challenge the ₹210 resistance zone.
FAQs
- Why is RSWM stock rising today?
The stock rallied after breaking above a consolidation zone and extending its existing uptrend on the daily chart.
- What does the RSI indicate for RSWM?
The RSI is near 77, indicating strong momentum but also suggesting the stock is in overbought territory.
- What are the key levels to watch in RSWM?
Support is seen near ₹190 and ₹177, while resistance is located around ₹210 and ₹225.