
Highlights
- Dhunseri Investments reported mixed financial performance for quarter ended December 31, 2025.
- Revenue streams include dividend income, fair value changes, and rental income contributions.
- Stock recorded notable intraday movement on March 30, 2026 with wide trading range.
Dhunseri Investments (NSE:DHUNINV) appeared among actively tracked stocks on March 30, 2026. The stock traded at ₹ 738.20, up ₹ 56.75 or 8.33% during the session.
The stock opened at ₹ 675.00 and touched a high of ₹ 775.00, while the low remained at ₹ 675.00. The previous closing price was ₹ 681.45, indicating a broad intraday range. The volume-weighted average price (VWAP) stood at ₹ 750.48.
Exchange indicators highlighted that earnings per share based on the previous four trailing quarters is zero, and trading participation has been limited, with fewer than 100 unique PANs in the last 30 days.
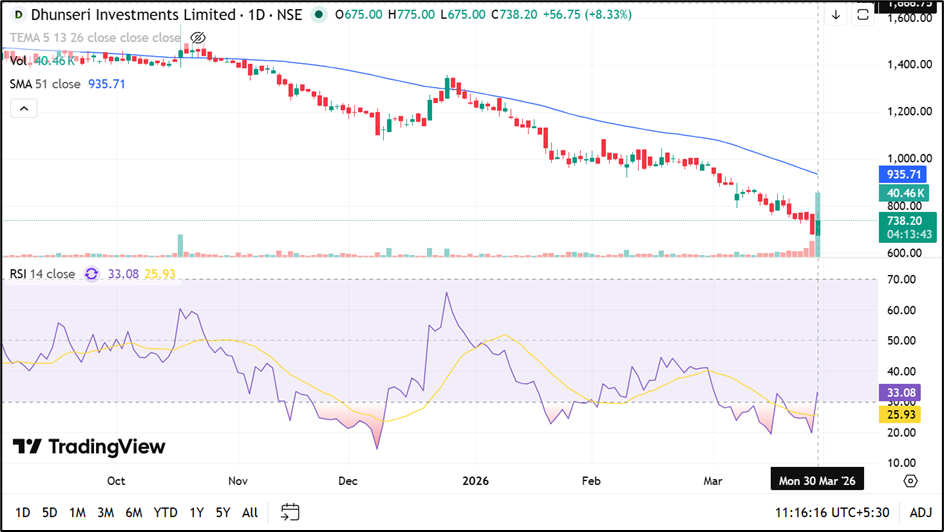
Source:TradingView
Financial Performance Overview
For the quarter ended December 31, 2025, the company reported total income of approximately ₹ 333.66 lakh, compared to ₹ 338.55 lakh in the corresponding quarter of the previous year.
Profit after tax for the quarter stood at negative ₹ 706.56 lakh, compared to a profit of ₹ 227.04 lakh in the same quarter last year. This reflects a shift in earnings performance on a year-on-year basis.
For the nine-month period ended December 31, 2025, total income was reported at ₹ 333.66 lakh, while profit after tax stood at ₹ 72.03 lakh.
Revenue Composition and Income Streams
The company’s revenue is derived from multiple sources, including dividend income, fair value changes on investments (realised and unrealised), rental income, and limited operational activities such as tea sales.
During the quarter, fair value changes—both realised and unrealised—contributed significantly to fluctuations in reported income. Dividend income also formed a notable component of revenue during the reporting period.
Expense Structure and Profitability Trends
Total expenses for the quarter stood at ₹ 114.05 lakh, including employee benefits, depreciation, and other operational costs. Finance costs remained minimal.
Despite controlled expenses, profitability was impacted due to variations in income streams, particularly fair value adjustments. Tax expenses also showed fluctuations, including deferred tax components.
Other comprehensive income reflected movements in equity instruments measured through fair value, contributing to overall comprehensive income variations.
Regulatory Indicators and Market Signals
Exchange data flagged certain indicators, including zero EPS based on trailing four quarters and relatively low trading participation. These factors may influence liquidity and price discovery in the stock.
The stock’s movement during the session reflects active price fluctuations within a defined trading band.
Key Risks
- Earnings volatility due to dependence on fair value investment changes.
- Low trading participation may impact liquidity and price stability.
- Negative quarterly profitability may affect investor sentiment.
- Concentration of income sources in non-operational revenue streams.
Summary
Dhunseri Investments Limited reported mixed financial results for the quarter ended December 31, 2025, with negative profitability despite diversified income sources. The company’s earnings remain influenced by fair value changes and dividend income.
The stock recorded notable intraday movement on March 30, 2026, alongside exchange indicators highlighting low participation and zero trailing EPS.
FAQs
- What were Dhunseri Investments’ latest quarterly earnings figures?
The company reported a net loss of ₹ 706.56 lakh for the quarter ended December 31, 2025. - What are the main sources of revenue for Dhunseri Investments?
Revenue primarily comes from dividend income, fair value changes, rental income, and limited operational activities. - Why is the stock showing zero EPS based on trailing quarters?
The trailing four-quarter earnings per share is reported as zero due to overall earnings performance during that period.