
Highlights
- Ducon Infratech stock declined during March 30, 2026 session with high volatility.
- Price moved close to 52-week low amid sharp multi-month fluctuations.
- Recent financials show profitability with modest earnings per share.
Ducon Infratechnologies (NSE:DUCON) recorded a decline on March 30, 2026. The stock traded at ₹2.25, down ₹0.26or 10.36%. The stock opened at ₹2.44 and moved within a range of ₹2.22 to ₹2.48. The intraday low of ₹ 2.22 also marks its 52-week low, while the previous close stood at ₹2.51. The VWAP was recorded at ₹2.34.
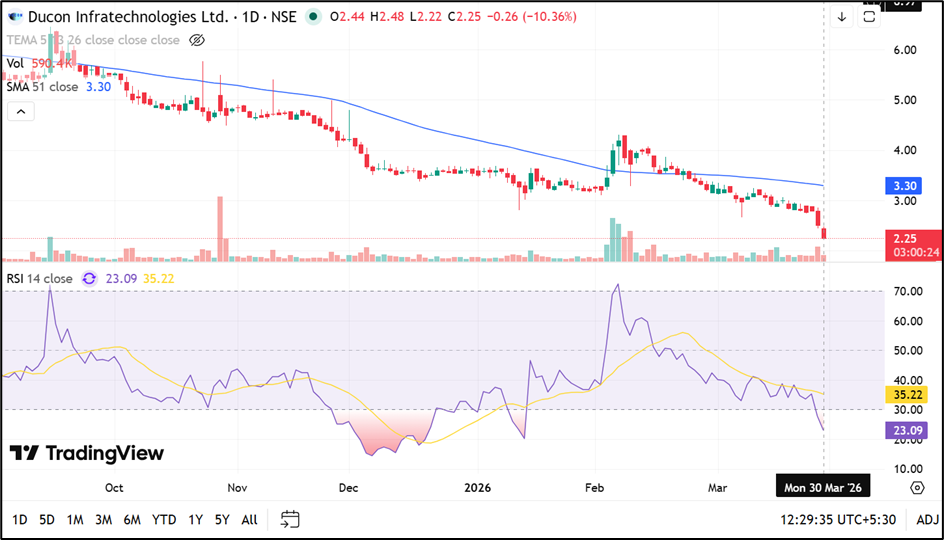
Source: TradingView
Volatility and Price Indicators
The stock has exhibited high volatility, with daily volatility at 3.32 and annualised volatility at 63.43. The price band is set at 20%, with an upper band of ₹3.01 and a lower band of ₹2.01.
Exchange indicators highlight that the stock has seen high-low price variation exceeding 75% over the past three months and over 100% in the past six months. The current price is significantly below the 52-week high of ₹7.18 recorded on June 3, 2025.
Financial Performance Snapshot
For the quarter ended December 31, 2025, the company reported total income of ₹9,430.83 lakh on a consolidated basis. Profit before tax stood at ₹339.49 lakh, while net profit was reported at ₹231.24 lakh. Earnings per share (EPS) for the quarter was ₹0.07. The financial results were disclosed on February 12, 2026.
Earnings and Profitability Context
The company reported profitability during the quarter, though earnings per share remain relatively low compared to revenue levels.
Profitability metrics indicate positive earnings, while stock price movement reflects broader market behavior and volatility trends.
Price Trend and Market Behavior
The stock has declined toward the lower end of its annual range, with a significant drop from its 52-week high. The wide gap between high and current price reflects extended price fluctuations. Intraday movement shows continued pressure, with the stock trading near its lower band during the session.
Key Risks
- High volatility may lead to sharp and frequent price swings.
- Significant price variation over recent months indicates instability.
- Low EPS relative to price may impact valuation perception.
- Price near 52-week low reflects sustained downward trend.
Summary
Ducon Infratechnologies Limited recorded a decline on March 30, 2026, with the stock trading near its 52-week low of ₹2.22. The company reported total income of ₹9,430.83 lakh and net profit of ₹231.24 lakh for Q3 FY26, with EPS at ₹0.07. The stock remains characterized by high volatility and wide price fluctuations.
FAQs
- What is the latest stock price movement of Ducon Infratech?
The stock declined 10.36% on March 30, 2026, trading at ₹2.25 during the session. - What are the recent financial results of Ducon Infratech?
The company reported ₹231.24 lakh net profit on ₹9,430.83 lakh income in Q3 FY26. - Why is the stock considered highly volatile?
The stock shows high annualised volatility of 63.43 with large price variations over recent months.