
Highlights
- Wonder Electricals stock declined sharply during March 30, 2026 trading session.
- Price touched 52-week low with high volatility and wide intraday movement.
- Recent financials reflect modest profitability with low earnings per share.
Wonder Electricals (NSE:WEL) witnessed notable downside movement on March 30, 2026. The stock traded at ₹ 103.80 , down ₹ 16.12 or 13.44%
The stock opened at ₹ 119.33 and remained at that level as its intraday high, while it fell to a low of ₹ 101.11, which also marks its 52-week low. The previous closing price stood at ₹ 119.92, with VWAP at ₹ 105.80.
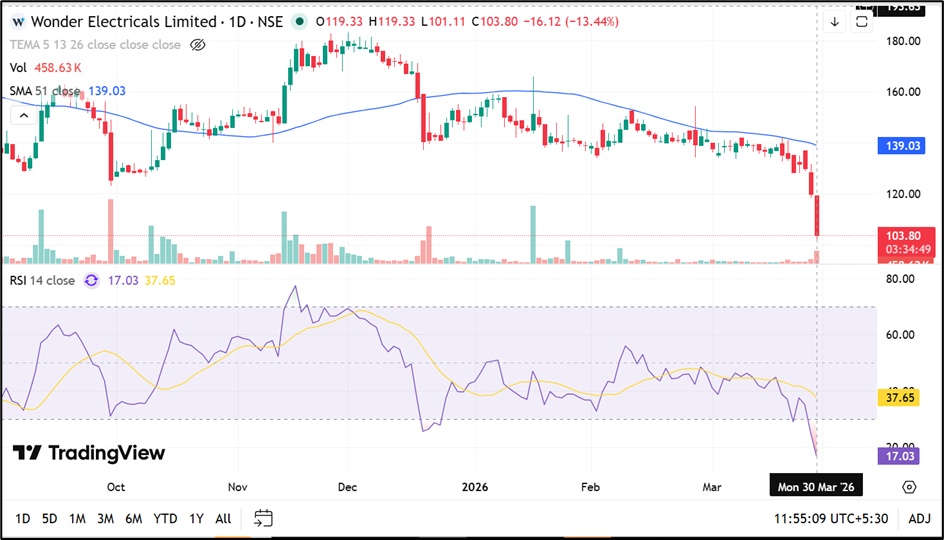
Source: TradingView
Volatility and Price Indicators
The stock has shown elevated volatility levels, with daily volatility at 3.11 and annualised volatility at 59.42. The price band for the stock is set at 20%, with an upper band of ₹ 143.90 and a lower band of ₹ 95.94.
The current price is significantly lower than the 52-week high of ₹ 190.50 recorded on May 26, 2025, indicating a broad range of price movement over the past year.
Exchange indicators also flagged that the stock’s price-to-earnings (PE) ratio is above 50 based on trailing four quarte₹
Financial Performance Snapshot
For the quarter ended December 31, 2025, the company reported total income of ₹ 15,255.83 lakh on a consolidated basis.
Profit before tax stood at ₹ 78.35 lakh, while net profit was reported at ₹ 56.57 lakh. Earnings per share (EPS) for the quarter was ₹ 0.04. The financial results were disclosed on February 11, 2026, as part of the company’s regular reporting cycle.
Earnings and Valuation Context
The relatively low EPS alongside a PE ratio above 50 highlights valuation levels in relation to earnings performance. Profitability remains modest compared to revenue scale. Market indicators suggest that valuation metrics and earnings levels are key data points being tracked in the stock.
Trading Range and Market Activity
The stock’s movement during the session reflects a wide intraday range, with a sharp decline from opening levels to the day’s low. The presence of defined upper and lower price bands indicates regulatory limits on daily price movement, while volatility metrics highlight fluctuations in trading behavior.
Key Risks
- High volatility may lead to sharp price fluctuations in short periods.
- Elevated PE ratio relative to low earnings per share.
- Profitability remains modest compared to revenue levels.
- Price near 52-week low may reflect broader market sentiment facto₹
Summary
Wonder Electricals Limited recorded a sharp decline on March 30, 2026, with the stock touching its 52-week low during the session. The company reported total income of ₹ 15,255.83 lakh and net profit of ₹ 56.57 lakh for Q3 FY26, with EPS at ₹ 0.04. Exchange indicators highlight high valuation and volatility metrics alongside recent price movement.
FAQs
- What is the latest stock price movement of Wonder Electricals?
The stock declined 13.44%. on March 30, 2026, trading at ₹ 103.80 during the session. - What are the recent financial results of Wonder Electricals?
The company reported ₹ 56.57 lakh net profit on ₹ 15,255.83 lakh total income in Q3 FY26. - Why is the stock considered highly volatile?
The stock shows high annualised volatility of 59.42 along with wide intraday price movements.