
Highlights
- PANSARI shares rallied nearly 15% and entered the NSE top gainers list.
- The stock witnessed a decisive breakout above recent trading ranges.
- Strong momentum and improving technical indicators attracted investor attention.
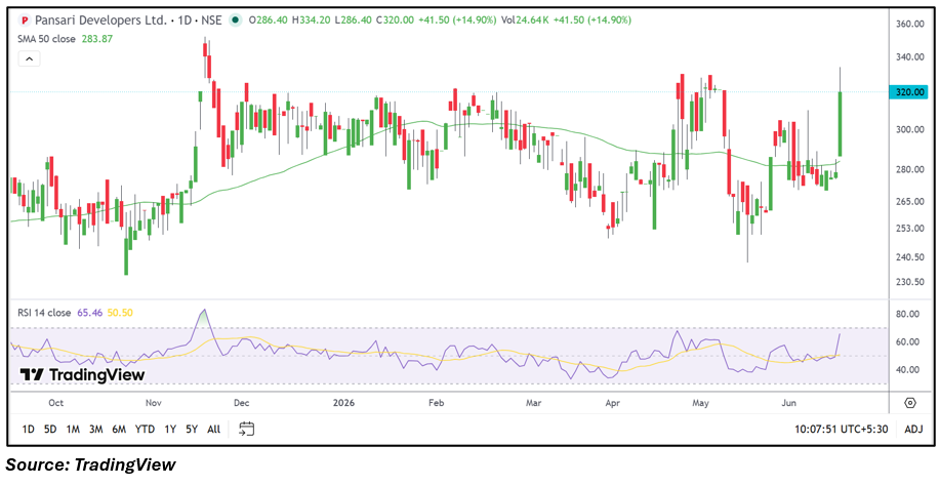
Pansari Developers Limited (NSE: PANSARI) came into focus on June 16 after its shares surged nearly 15% during intraday trading. The stock climbed to an intraday high of ₹334.20 and was trading around ₹320.00, up ₹41.50 from the previous close of ₹278.50.
The sharp rally pushed the stock into the top gainers list on the NSE, with traders responding to a strong technical breakout supported by higher volumes and renewed market interest.
Strong Buying Momentum Lifts the Stock
PANSARI opened at ₹286.40 and quickly attracted buying interest, moving sharply higher throughout the session. The stock crossed multiple short-term resistance levels and reached its highest level in several weeks.
The breakout follows a period of consolidation around the ₹270–₹300 zone. Such moves often draw momentum traders looking for stocks displaying fresh strength and improving price action.
Financial Snapshot
For the quarter ended March 2026, the company reported:
- Total Income: ₹2,621.16 lakh
- Profit Before Tax: ₹967.24 lakh
- Net Profit: ₹797.98 lakh
- Earnings Per Share (EPS): ₹4.61
The company remained profitable during the reported quarter, providing a supportive backdrop for investor sentiment.
Technical View
Technically, PANSARI has delivered a notable breakout. The stock is trading above its 50-day Simple Moving Average of ₹283.87, indicating a positive medium-term trend.
The Relative Strength Index (RSI) has moved above 65, reflecting strengthening bullish momentum. The sharp bullish candle visible on the chart suggests strong participation from buyers after several weeks of range-bound trading.
A successful breakout above the ₹300 zone has improved the stock’s near-term technical structure and shifted momentum in favor of the bulls.
Key Technical Levels
From the current market price of ₹320.00, immediate support is placed near ₹304.00, while a stronger support zone is seen around ₹288.00. On the upside, the stock may face resistance near ₹336.00. A sustained move above this level could bring the ₹352.00 zone into focus.
Risks to Watch
- Sharp rallies can trigger profit-booking activity.
- Low trading participation may increase price volatility.
- Failure to sustain above breakout levels could weaken momentum.
- Small-cap stocks often witness larger price swings.
Summary
Pansari Developers shares surged nearly 15% on June 16 as strong buying momentum, rising volumes, and a breakout above recent resistance levels attracted trader interest. The stock is now trading above its 50-day moving average and showing improving momentum indicators. Investors will closely monitor whether the stock can hold above breakout support levels and extend gains toward higher resistance zones.
Frequently Asked Questions
Why did PANSARI shares rise today?
The stock rallied on strong buying interest, higher volumes, and a breakout above key technical resistance levels.
What does the technical chart indicate?
The chart suggests bullish momentum, with the stock trading above its 50-day moving average and recent consolidation zone.
What levels should investors watch?
Support is seen near ₹304.00 and ₹288.00, while resistance is located around ₹336.00 and ₹352.00.