
Highlights
- RPTECH shares surged nearly 14% and entered the NSE top gainers list.
- The stock broke above recent consolidation levels with strong volumes.
- Price action remains firmly above the 50-day moving average, indicating bullish momentum.
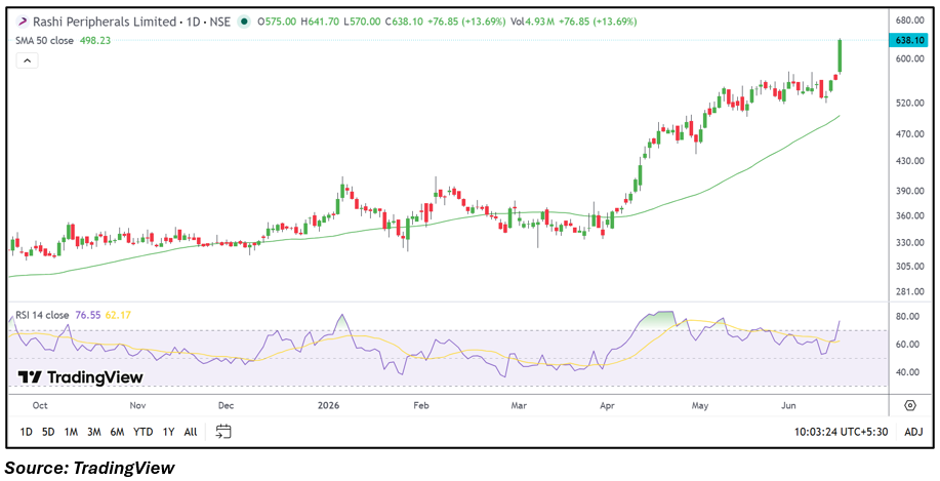
Rashi Peripherals Limited (NSE: RPTECH) attracted strong buying interest on June 16, with its shares rising nearly 14% during intraday trade. The stock climbed to an intraday high of ₹641.70 and was trading around ₹639.50, up ₹78.25 from the previous close of ₹561.25.
The sharp move comes as the stock extends its ongoing uptrend and breaks above a recent consolidation range, supported by strong trading volumes and positive technical indicators.
Momentum Buying Pushes RPTECH Higher
RPTECH opened at ₹575.00 and witnessed sustained buying throughout the session. The stock quickly crossed recent swing highs and moved toward fresh highs, reflecting strong market participation.
The rally also follows a broader uptrend that has been visible since April, during which the stock has consistently formed higher highs and higher lows. Such price action often attracts momentum traders looking for breakout opportunities.
Financial Performance Remains in Focus
For the quarter ended March 2026, the company reported:
- Total Income: ₹4,50,542.60 lakh
- Profit Before Tax: ₹11,363.20 lakh
- Net Profit: ₹8,683.70 lakh
- Earnings Per Share (EPS): ₹12.78
The latest quarterly performance reflects profitability and operational scale, which may have contributed to positive investor sentiment toward the stock.
Technical View
From a technical standpoint, RPTECH remains in a strong uptrend. The stock is trading well above its 50-day Simple Moving Average of ₹498.23, highlighting sustained bullish strength.
The breakout above the recent trading range near ₹580–₹600 has strengthened the positive structure. Additionally, the Relative Strength Index (RSI) has moved above 76, indicating strong momentum. While such readings suggest the stock is entering overbought territory, they also confirm the intensity of the current buying interest.
The breakout candle, accompanied by elevated volumes, suggests that traders are actively accumulating the stock after several weeks of consolidation.
Key Technical Levels
Technically, immediate support is placed near ₹600.00, followed by a stronger support zone around ₹560.00. As long as the stock remains above these levels, the broader uptrend remains intact. On the upside, the next resistance is seen near ₹650.00, while sustained buying above this zone could bring the ₹680.00 area into focus.
Risks to Watch
- Overbought RSI levels may trigger short-term profit booking.
- Failure to sustain above breakout levels could increase volatility.
- Sharp rallies often attract quick trader-led exits.
- Market-wide weakness could impact momentum stocks.
Summary
Rashi Peripherals shares surged nearly 14% on June 16, driven by strong momentum, rising volumes, and a breakout above recent resistance levels. The stock continues to trade comfortably above its 50-day moving average, reinforcing the bullish trend. Investors will now monitor whether RPTECH can sustain above the breakout zone and extend gains toward higher resistance levels in the coming sessions.
Frequently Asked Questions
Why is RPTECH stock rising today?
The stock gained sharply due to a technical breakout, strong trading volumes, and continued bullish momentum.
What does the chart indicate for RPTECH?
The chart shows a strong uptrend with the stock trading above key moving averages and recent resistance levels.
What levels should investors watch?
Support is seen near ₹600.00 and ₹560.00, while resistance is located around ₹650.00 and ₹680.00.