
Highlights
- TCS shares declined sharply after a strong three-session rally in IT stocks.
- Profit booking emerged across the technology sector despite recent gains.
- Broader concerns around IT spending and AI-led disruption remained in focus.
Overview
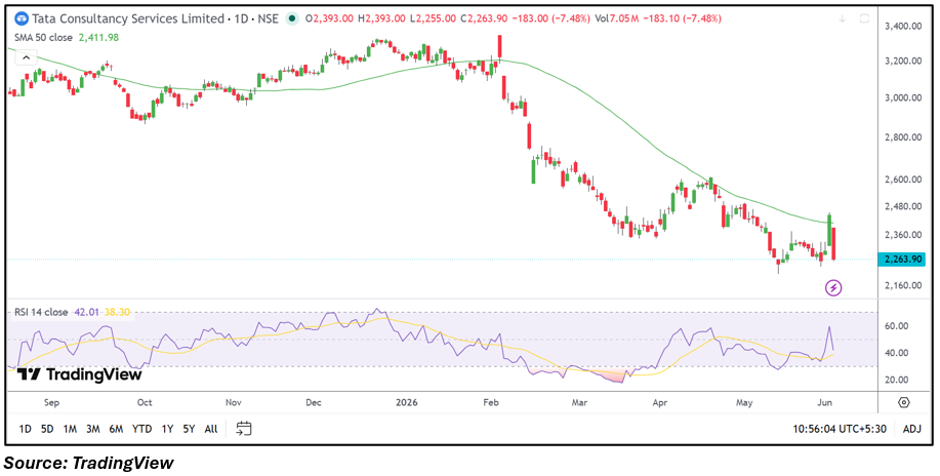
Tata Consultancy Services (NSE: TCS) witnessed significant selling pressure on June 3, with the stock falling 7.48% to ₹2,263.90. The decline came after TCS had participated in a sharp rebound over the previous sessions, where the broader Nifty IT index had advanced more than 6%. Market participants appeared to lock in gains following the recent rally, leading to a broad-based correction across frontline IT stocks. (The Economic Times)
Why Did TCS Stock Fall Today?
The primary trigger behind the decline appears to be profit booking after a rapid recovery in IT shares. TCS, Infosys, HCL Tech, Wipro and Tech Mahindra all came under pressure as investors booked gains accumulated during the recent technology rally. The Nifty IT index, which had rallied strongly over the past three sessions, reversed sharply as sentiment cooled. (The Economic Times)
Investors also remain cautious regarding global technology spending trends and the long-term impact of artificial intelligence on traditional IT services businesses. Concerns around muted client spending and growth visibility have continued to influence sector sentiment during recent months. (The Economic Times)
Additionally, some market participants rotated capital toward domestic-facing sectors after the recent IT outperformance, contributing to the sharp pullback in technology counters. (HDFC Sky)
Technical View
TCS traded at ₹2,263.90 and remained below its 50-day SMA of ₹2,411.98, reflecting a weak intermediate-term technical structure. The stock initially attempted a recovery move during recent sessions but failed to sustain gains near the moving average resistance zone. The latest decline has pushed the stock back toward its recent trading lows, indicating renewed selling pressure.
The RSI dropped to 42.01 after briefly recovering during the previous rally. Momentum has weakened and remains below the neutral 50 mark, suggesting that upside strength has faded following the sharp reversal.
Key Technical Levels
On the downside, immediate support is placed near ₹2,150, followed by a stronger support zone around ₹2,040. A sustained break below these levels could increase downside pressure in the near term.
On the upside, the stock may face resistance near ₹2,377, which is close to the recent swing area. The next major resistance level is positioned around ₹2,490, where selling pressure may re-emerge.
Key Risks to Watch
- Weak global technology spending trends.
- Slower client decision-making and project ramp-ups.
- AI-related disruption concerns across IT services.
- Continued sector-wide profit booking.
Summary
TCS shares declined sharply as investors booked profits following a strong IT sector rally. While the company's financial performance remains substantial, market sentiment has shifted toward caution amid concerns over growth visibility, AI-related disruption, and global technology spending trends. Technically, the stock remains below its 50-day SMA, with traders likely monitoring support levels around ₹2,150 and ₹2,040 for near-term direction.
FAQs
Why did TCS shares fall today?
The decline was largely driven by profit booking after a sharp three-session rally in the IT sector.
Is the fall specific to TCS?
No. Major IT companies including Infosys, Wipro, HCL Tech and Tech Mahindra also witnessed selling pressure.
What are the key levels to watch in TCS?
Support is seen near ₹2,150 and ₹2,040, while resistance is located near ₹2,377 and ₹2,490.