
Highlights
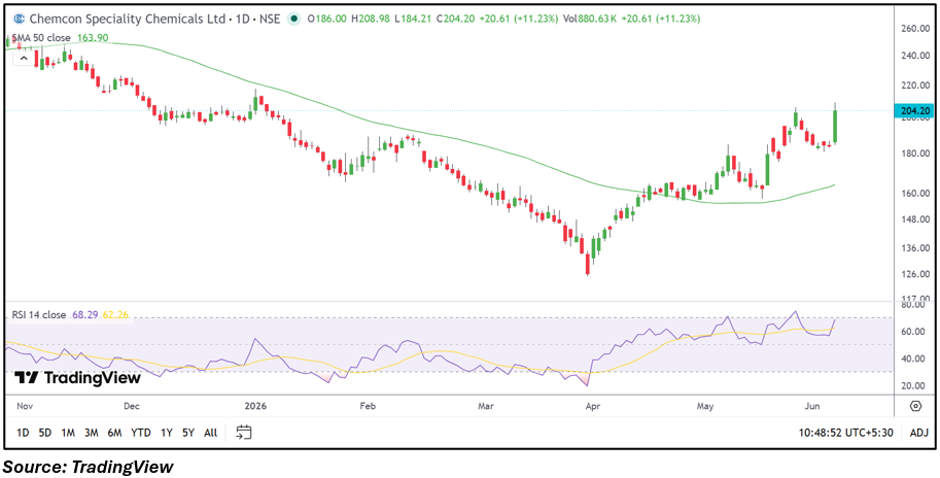
- Chemcon shares surged above the ₹200 mark with strong momentum.
- The stock moved decisively above its 50-day SMA, improving trend structure.
- RSI climbed near overbought territory, reflecting accelerating bullish momentum.
Overview
Chemcon Speciality Chemicals (NSE: CHEMCON) emerged among the top gainers on June 5, with the stock rising 11.24% to ₹204.22. The rally comes after a sustained recovery from its March lows, extending the stock’s upward trajectory and pushing it to fresh multi-month highs. The move follows the company's recent quarterly earnings announcement, where it reported net profit of ₹637.13 lakh on total income of ₹7,957.72 lakh for the quarter ended March 2026.
Fundamental View
Chemcon reported profit after tax of ₹637.13 lakh and earnings per share of ₹1.74 for the March 2026 quarter. Profit before tax stood at ₹879.26 lakh, while total income came in at ₹7,957.72 lakh. The latest results indicate the company remained profitable during the quarter, providing a fundamental backdrop as investors reassessed the stock following recent earnings disclosures.
Technical View
CHEMCON traded at ₹204.22, significantly above its 50-day SMA of ₹163.90, indicating an improved medium-term trend structure. The stock has been forming a series of higher highs and higher lows since April, reflecting sustained upward momentum. The latest breakout candle pushed prices above the previous consolidation zone and helped the stock reclaim the psychological ₹200 level. The 14-day RSI climbed to 68.29, suggesting strong momentum while remaining just below overbought territory.
Momentum Indicator
The RSI reading of 68.29 highlights accelerating bullish momentum. The indicator has remained above its signal line and continues to trend higher, supporting the ongoing upward move. While momentum remains favorable, traders may also watch for short-term consolidation after the sharp advance.
Key Technical Levels
The stock has moved above an important breakout region near ₹190.00, which may now act as an immediate support zone during any pullback. A secondary support area is visible around ₹184.00, close to the recent consolidation range. On the upside, resistance is seen near ₹209.00, which corresponds to the recent intraday high, while a sustained move above that level could open the path toward the ₹220.00 zone.
Risks to Watch
- Sharp profit booking after the recent rally.
- RSI approaching overbought conditions.
- Volatility in the specialty chemicals sector.
- Failure to sustain above breakout levels.
Summary
Chemcon Speciality Chemicals shares extended their recent rally as improving price action, a breakout above consolidation resistance, and supportive quarterly earnings helped attract market attention. Trading well above its 50-day SMA with RSI near 68.29, the stock currently maintains positive momentum. Sustaining above the recent breakout zone will be important for determining whether the rally can continue toward higher resistance levels.
FAQs
Why did Chemcon shares rise today?
The stock gained after extending its breakout above consolidation resistance and maintaining positive momentum above key moving averages.
What is the key support level for CHEMCON?
The immediate support zone is around ₹190.00, followed by a secondary support area near ₹184.00.
Is Chemcon trading above its 50-day SMA?
Yes, the stock is trading at ₹204.22, comfortably above its 50-day SMA of ₹163.90.