
Highlights
- The stock dropped over 8% and is trading near ₹282 level.
- RSI near 42 shows weak momentum and no overbought pressure.
- Price slipped below 51-day SMA, indicating short-term weakness.
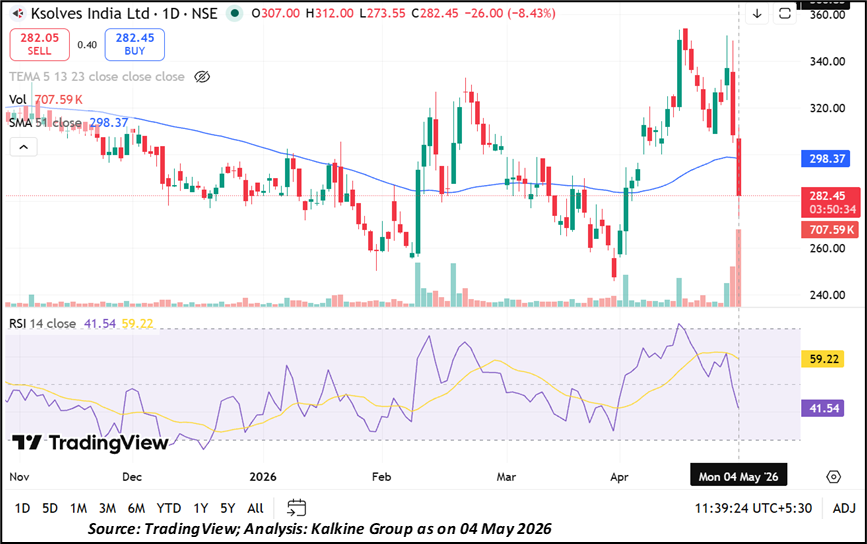
Shares of Ksolves India (NSE:KSOLVES) saw a decline in the latest session. The stock fell around 8.43% to ₹282.45, compared to the previous close of ₹308.46. It opened at ₹307.00 and moved between ₹273.55 and ₹312.00 during the session before settling lower.
The traded volume stood at 7.09 lakh shares, with a traded value of ₹20.25 crore. The company has a total market cap of ₹669.27 crore and a free float market cap of ₹274.24 crore, showing small-cap positioning.
Technical Indicators Show Weak Trend
The stock has moved below its 51-day simple moving average (SMA) near ₹298.37, which suggests short-term weakness. The 14-day RSI is around 41.54, indicating weak momentum and no signs of overbought conditions.
Immediate support is placed between ₹240.00 and ₹260.00. On the upside, resistance is seen in the ₹320.00 to ₹350.00 range. The stock may move within this range in the near term.
Returns Show Weak Performance
The stock has underperformed the broader market across most time periods. In one week, it declined 13.65%, while the NIFTY 50 gained 0.58%.
In one month, the stock fell 1.32%, compared to a gain of 6.69% in the index. Year-to-date, it is slightly down by 0.86%, while the NIFTY 50 is down 7.32%. Over one year, the stock declined 38.85%.
Over three years, the stock is down 12.96%, but over five years, it has gained 343.88%, showing strong long-term performance despite recent weakness.
Trading Activity and Volatility
The stock has moderate liquidity with an impact cost of 0.22, suggesting some price movement during trades. The deliverable quantity stands at 25.53%, indicating higher short-term trading activity.
Annualised volatility is 56.36, which shows that price movements can be sharp.
Key Risks to Monitor
- Price below SMA indicates short-term weakness.
- RSI near 42 shows weak momentum.
- One-year returns remain negative.
- Volatility can lead to sudden price swings.
Technical Summary
Ksolves India (NSE:KSOLVES) is trading near ₹282.45, down around 8.43%, and has fallen below its 51-day SMA near ₹298.37, while the 14-day RSI near 41.54 points. Immediate support is placed in the ₹240.00–₹260.00 zone, while resistance is now seen back toward the ₹320.00–₹350.00 range.
Summary
Ksolves India Ltd. (NSE:KSOLVES) stock fell over 8% to ₹282.45 and moved below its 51-day SMA, showing short-term weakness. RSI indicates weak momentum, and recent returns remain negative. The stock has underperformed the broader market in recent periods. Support is placed between ₹240 and ₹260, while resistance is seen in the ₹320 to ₹350 range.
FAQs
- Why did Ksolves India stock fall today?
The stock declined due to selling pressure and a break below its short-term average, indicating weakness in trend. - What does RSI near 42 indicate?
RSI near 42 shows weak momentum and suggests the stock is neither overbought nor oversold currently. - What are key levels to watch now?
Support is between ₹240 and ₹260, while resistance is expected in the ₹320 to ₹350 range.