
Highlights
- Godrej Industries shares surged more than 14% with strong expansion in trading volumes.
- Stock crossed above key technical zones and moved near fresh multi-month highs.
- RSI entered elevated territory as momentum accelerated above the 50-day SMA.
Overview
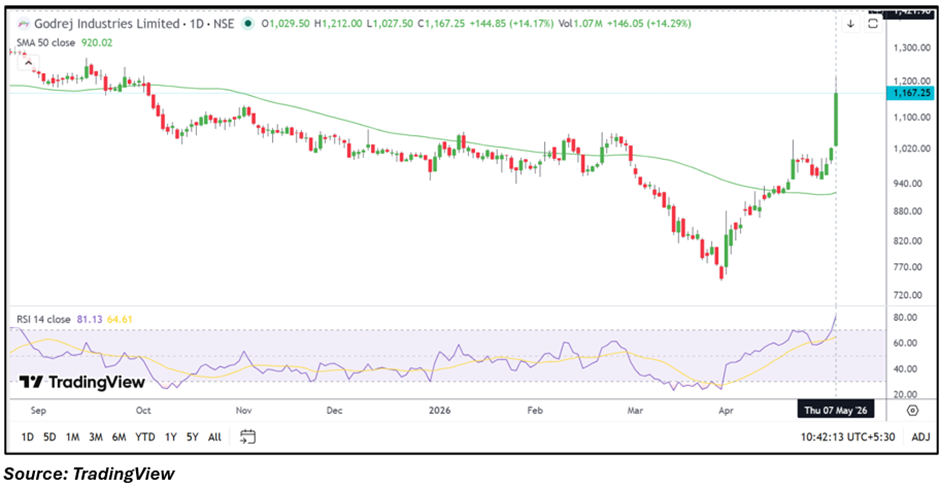
Godrej Industries (NSE: GODREJIND) gained 14.53% on May 7, 2026, touching an intraday high of ₹1,212.00 during strong momentum-led trade. The stock opened at ₹1,029.50 against the previous close of ₹1,022.40 and remained among the top gainers during the session.
The rally pushed the stock decisively above its 50-day simple moving average near ₹920.02, improving the near-term technical structure after a sustained recovery from March lows. The move also placed the stock close to fresh multi-month highs with increased market participation.
Fundamental View
For the quarter ended December 31, 2025, Godrej Industries reported consolidated total income of INR 5,69,759.00 lakh. Profit before tax stood at INR 37,459.00 lakh, while consolidated net profit came at INR 35,268.00 lakh. Earnings per share for the quarter was reported at INR 6.07.
Market participants continue monitoring business performance across chemicals, real estate, consumer products, agri-business, and financial services segments, along with broader demand trends across the group’s diversified operations.
Technical View
Godrej Industries is trading near ₹1,170.95, up 14.53%, and remains firmly above its 50-day SMA around ₹920.02, indicating a significantly improved near-term setup. Price action reflects a strong breakout move after a prolonged consolidation and recovery phase visible over recent months.
The 14-day RSI has climbed near 81.13, suggesting momentum has strengthened sharply and entered overbought territory following the recent rally. The stock also witnessed a notable expansion in volatility as prices crossed the ₹1,150 zone.
Momentum Indicator
The RSI has moved above the 80 level, indicating elevated momentum conditions after the sharp upward move. Such readings may also keep short-term price swings active near higher resistance levels.
Key Technical Levels
- Immediate Support: ₹1,050.00
- Secondary Support: ₹980.00
- Immediate Resistance: ₹1,300.00
- Higher Resistance: ₹1,400.00
Risks To Watch
- Elevated RSI levels may trigger short-term consolidation.
- Sharp price swings can increase near-term volatility.
- Weakness in diversified business segments may affect earnings visibility.
- Sustaining momentum above ₹1,050 remains technically important.
Summary
Godrej Industries shares rallied sharply as momentum strengthened above key technical levels, helping the stock move near fresh multi-month highs. The breakout above the 50-day SMA improved the short-term technical structure, while elevated RSI readings reflected accelerated momentum. Traders may continue monitoring resistance near ₹1,300–₹1,400 and support stability around ₹1,050 in the near term.
FAQs
Why did Godrej Industries shares rise sharply today?
The stock gained after witnessing strong momentum-driven trading activity and a breakout above important technical levels.
What are the important support levels for GODREJIND?
Immediate support is placed near ₹1,050, while the next major support zone is around ₹980.
Why is RSI important for Godrej Industries currently?
RSI near 81 indicates elevated momentum and suggests the stock may witness volatile near-term price movement.