
Highlights
- The stock has moved above its 50-day SMA, indicating a potential recovery trend.
- RSI reflects strengthening momentum, nearing overbought levels after recent gains.
- Resistance zone ahead may lead to consolidation in the near term.
Kamdhenu Ventures (NSE:KAMOPAINTS) is trading near INR 5.82, reflecting a gain of around 2.28% in the latest session. The stock has moved above its 50-day simple moving average at INR 4.72, indicating a shift from a prior downtrend toward a recovery phase.
The rebound follows a recovery from the 52-week low of INR 3.60 recorded in March 2026. Prices are now approaching a resistance zone between INR 6.20 and INR 6.80, which may act as a near-term barrier. Immediate support is placed in the INR 5.00–4.60 range, which could provide stability during any pullback.
Momentum Indicators Show Improving Strength
The 14-day Relative Strength Index (RSI) stands near 69.63, indicating strengthening momentum and nearing overbought territory. This suggests that buying interest has increased, although the pace of gains may moderate in the near term.
The intraday range between INR 5.60 and INR 5.85 highlights moderate price movement. The VWAP at INR 5.76 indicates that the stock is trading slightly above its average traded price, supporting the ongoing upward bias. Daily volatility stands at 3.18, while annualised volatility is at 60.75, indicating potential for price fluctuations.
Financial Snapshot Reflects Mixed Performance
For the quarter ended December 2025, standalone total income stood at INR 1.14 lakh, with a loss before tax of INR 19.31 lakh and net loss at the same level. Earnings per share came in at negative INR 0.01.
On a consolidated basis, total income stood at INR 6,334.94 lakh, with profit before tax at INR 146.31 lakh and net profit at INR 99.13 lakh. Earnings per share came in at INR 0.03. These figures reflect a divergence between standalone and consolidated performance.
Trading Activity and Liquidity
The stock recorded traded volume of 3.03 lakh shares, translating into a traded value of INR 0.17 crore. The total market capitalisation stands at INR 182.95 crore, with free float market cap at INR 90.73 crore.
The impact cost of 0.55 indicates moderate liquidity conditions, while price band limits of 5% suggest controlled intraday movement.
Technical Summary
Kamdhenu Ventures Ltd. is trading near ₹5.82, up around 2.28%, and has moved above the 50-day SMA near ₹4.72, with the 14-day RSI near 69.63 points to strengthening momentum, just below overbought territory. Immediate support is placed in the ₹5.00–4.60 zone, while resistance is seen near the ₹6.20–6.80 range.
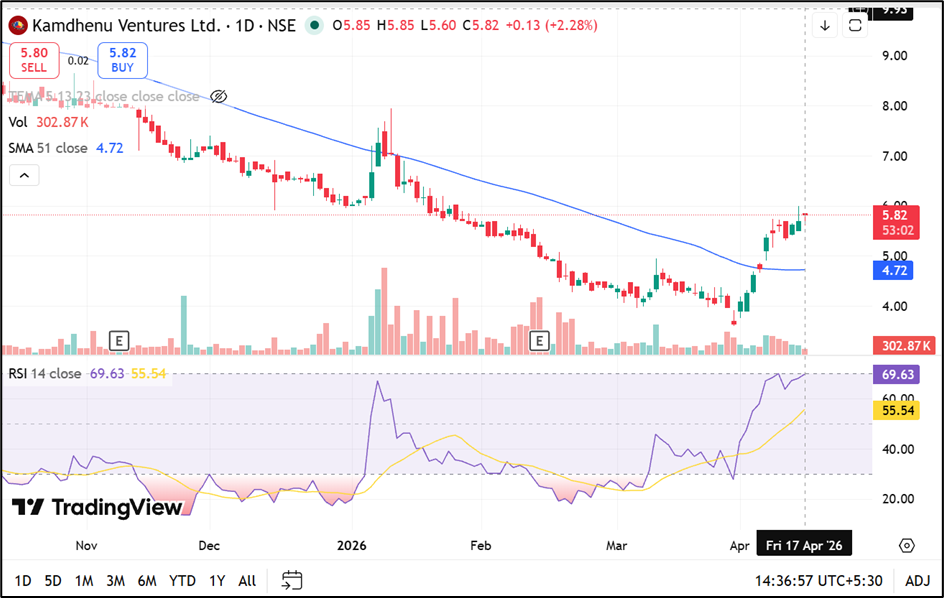
Source: TradingView
Key Risks to Monitor
- Resistance zone near INR 6.20–6.80 may limit further upside.
- RSI nearing overbought levels could trigger short-term consolidation.
- Weak standalone financial performance may weigh on sentiment.
- Moderate liquidity may increase volatility during market movements.
Summary
Kamdhenu Ventures Ltd. has moved above its 50-day SMA, indicating a potential recovery phase supported by improving momentum. However, resistance levels ahead and RSI nearing overbought territory suggest that the stock may consolidate in the near term. Mixed financial performance and moderate liquidity remain key factors influencing price movement.
FAQs
What does trading above the 50-day SMA indicate?
It suggests a potential trend shift, indicating recovery after a period of price decline.
Is RSI near 70 supportive of further upside?
It indicates strong momentum but also suggests the possibility of consolidation near current levels.
What are the key support and resistance levels?
Support is placed at INR 5.00–4.60, while resistance is seen between INR 6.20 and INR 6.80.