
Highlights
- Manali Petrochemicals shares gained 14.52% after the company announced Q4FY26 earnings.
- Net profit for the March quarter stood at INR 2,701.00 lakh with stable revenue growth.
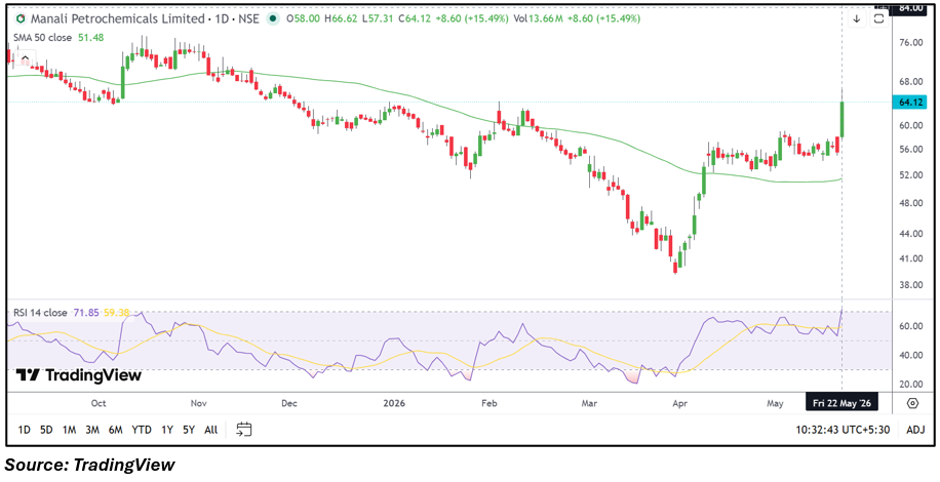
- The stock moved above its 50-day SMA while RSI entered the overbought region.
Overview
Manali Petrochemicals Limited (NSE: MANALIPETC) witnessed strong buying activity on May 22, 2026, with the stock rising sharply near INR 63.58 during intraday trade. The rally followed the company’s latest quarterly earnings release, which improved investor sentiment around the stock after recent consolidation phases.
Trading volumes also increased notably during the session, reflecting heightened market participation following the Q4FY26 announcement.
Fundamental View
For the quarter ended March 2026, the company reported standalone total income of INR 25,671.34 lakh. Profit before tax stood at INR 3,273.53 lakh, while net profit came in at INR 2,701.00 lakh. Earnings per share for the quarter were reported at INR 1.57.
The latest quarterly performance appears to have strengthened market sentiment, especially as investors reacted positively to profitability and earnings growth.
Technical View
The stock is currently trading near INR 63.58, well above its 50-day SMA placed around INR 51.48, reflecting improving near-term price structure. Recent price action indicates a sharp upward breakout supported by strong momentum and expanded trading activity.
The 14-day RSI has climbed near 71.85, indicating stronger momentum conditions while also placing the stock in the overbought zone in the short term. Sustained movement above current levels may keep volatility elevated in upcoming sessions.
Momentum Indicator
Momentum indicators strengthened sharply after the earnings-driven rally. RSI crossed above the neutral zone and entered overbought territory, while price action reclaimed levels above the 50-day moving average. The latest move also reflects renewed investor participation after a prolonged recovery phase from lower levels seen earlier this year.
Key Technical Levels
Immediate support is placed near the INR 58.00-55.00 zone, which could act as an important short-term stability area during any corrective move. On the upside, resistance is expected around INR 68.00-72.00, where traders may monitor breakout continuation or profit-booking activity.
Risks to Watch
- RSI near overbought levels may trigger short-term volatility.
- Sharp rallies can attract profit-booking pressure at higher levels.
- Sustaining volume momentum remains important after the breakout.
- Weakness in broader chemical sector sentiment could affect momentum.
Summary
Manali Petrochemicals shares rallied sharply after the company reported its latest quarterly earnings, with investors reacting positively to profitability and earnings growth. The stock moved decisively above its 50-day SMA, while momentum indicators strengthened significantly. Although near-term sentiment has improved, resistance near INR 68.00-72.00 and elevated volatility remain important factors to monitor.
FAQs
- Why did Manali Petrochemicals shares rise sharply today?
The stock gained after the company reported improved quarterly profit and earnings performance. - What are the key support levels for Manali Petrochemicals stock?
Immediate support is placed near the INR 58.00-55.00 zone. - What resistance levels should traders monitor now?
The next resistance area for the stock is near INR 68.00-72.00.