
Highlights
- Agri-Tech (India) shares surged more than 18% in Monday's session.
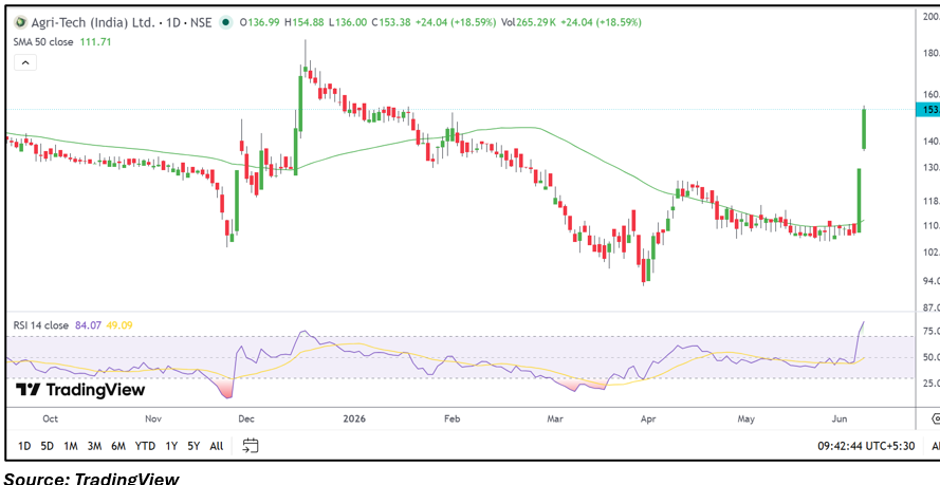
- The stock moved sharply above its 50-day SMA of ₹111.71.
- RSI crossed 84.00, reflecting exceptionally strong short-term momentum.
Overview
Agri-Tech (India) Limited (NSE: AGRITECH) emerged among the top gainers on June 8, with the stock rising 18.29% to ₹153.00. The rally pushed the share price to its highest level in several months and marked a decisive breakout from the consolidation range seen over recent weeks. The stock traded between ₹136.00 and ₹154.88 during the session, reflecting strong upward momentum.
Fundamental View
For the quarter ended March 2026, the company reported total income of INR 5.95 lakh. Profit before tax stood at a loss of INR 26.75 lakh, while net loss was INR 26.75 lakh. Earnings per share came in at negative INR 0.33. Despite the latest quarterly loss, the stock witnessed significant price appreciation during the session as traders focused on the technical breakout.
Technical View
AGRITECH has delivered a strong breakout on the daily chart after spending several weeks consolidating near the ₹105.00–₹112.00 zone. The stock has moved decisively above its 50-day SMA of ₹111.71, indicating a notable improvement in the medium-term technical structure.
The breakout candle is accompanied by a sharp expansion in momentum, suggesting aggressive participation from market participants. Price action has also surpassed multiple recent swing highs, placing the stock in a fresh upward phase following months of range-bound movement.
Momentum Indicator
The 14-day RSI stands at 84.07, which places the stock in deeply overbought territory. While such readings reflect powerful momentum, they can also increase the possibility of short-term consolidation after a rapid advance.
Key Technical Levels
Based on the current market price of ₹153.00, the first support is placed near ₹145.35, while the next support is seen around ₹137.70. On the upside, immediate resistance is positioned near ₹160.65, followed by the next resistance around ₹168.30. Sustaining above the first support level could help preserve the positive structure, while a move above the first resistance may keep the rally intact.
Risks to Watch
- RSI is in deeply overbought territory.
- Sharp rallies can trigger profit-booking.
- Low trading participation may increase volatility.
- Failure to hold breakout levels could weaken momentum.
Summary
Agri-Tech (India) shares surged sharply after breaking out from a prolonged consolidation range on the daily chart. The stock is trading well above its 50-day SMA of ₹111.71, while the RSI at 84.07 reflects exceptionally strong momentum. Although the technical structure has improved significantly, investors may watch whether the stock can sustain above its recent breakout zone following the rapid advance.
FAQs
- Why did AGRITECH shares rally today?
The stock witnessed a strong technical breakout from consolidation, resulting in a sharp upward move.
- Is AGRITECH trading above its key moving average?
Yes, the stock is trading comfortably above its 50-day SMA of ₹111.71.
- What are the important levels to watch?
Support is near ₹145.35 and ₹137.70, while resistance is around ₹160.65 and ₹168.30.