
Highlights
- Avalon Technologies shares surged over 10% after FY26 earnings announcement.
- Stock crossed the ₹1,400 mark intraday amid strong momentum activity.
- RSI moved into elevated territory as breakout momentum accelerated sharply.
Overview
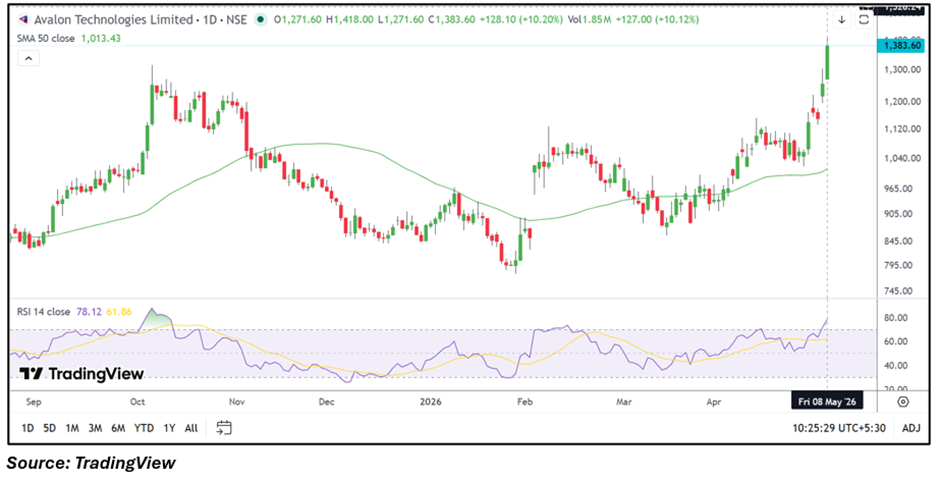
Avalon Technologies (NSE: AVALON) gained 10.43% on May 8, 2026, trading near ₹1,386.50 during the session after the company reported FY26 financial results. The stock touched an intraday high of ₹1,418.00 compared to the previous close of ₹1,255.50.
The sharp move placed the stock among the key gainers in the electronics manufacturing segment while also attracting increased trading activity during the session.
Fundamental View
For the quarter ended March 31, 2026, Avalon Technologies reported consolidated total income of INR 49,181.10 lakh. Profit before tax stood at INR 5,626.40 lakh, while consolidated net profit came at INR 4,115.10 lakh. Earnings per share for the quarter was reported at INR 6.16.
Market participants continue tracking export demand visibility, electronics manufacturing growth trends, operating margins, and execution pipeline across industrial and engineering-focused programs.
Technical View
Avalon Technologies is trading near ₹1,386.50, up 10.43%, and remains firmly above its 50-day SMA around ₹1,013.43, indicating a significantly improved near-term structure. Price action reflects a decisive breakout move after the stock consolidated in the ₹1,050–₹1,250 range over recent weeks.
The latest rally also pushed the stock closer to fresh multi-month highs amid expanding volumes and stronger directional momentum.
Momentum Indicator
The 14-day RSI climbed near 78.12, suggesting momentum has strengthened sharply and entered elevated territory following the breakout rally. Higher RSI readings may also increase the probability of short-term volatility near resistance levels.
Key Technical Levels
- Immediate Support: ₹1,300.00
- Secondary Support: ₹1,200.00
- Immediate Resistance: ₹1,500.00
- Higher Resistance: ₹1,600.00
Risks To Watch
- Elevated RSI may trigger short-term profit booking.
- Sharp rallies can increase near-term volatility.
- Weak global electronics demand may affect growth visibility.
- Sustaining momentum above ₹1,300 remains technically important.
Summary
Avalon Technologies surged after its FY26 results, breaking out above key technical levels. The move strengthened the near-term trend and pushed momentum indicators into overbought territory. Traders may watch whether the stock holds above ₹1,300 as it nears resistance around ₹1,500–₹1,600.
FAQs
Why did Avalon Technologies shares rise sharply today?
The stock rallied after FY26 financial results and strong momentum-led trading activity supported the breakout move.
What are the important support levels for AVALON?
Immediate support is placed near ₹1,300, while the next important support zone is around ₹1,200.
Why is RSI important for Avalon Technologies currently?
RSI near 78 indicates elevated momentum and suggests the stock may remain volatile in the near term.