
Highlights
- Exicom Tele-Systems shares rallied more than 16% during Thursday’s trading session.
- The stock gained momentum after the company reported March 2026 quarter earnings.
- Price action strengthened sharply as the stock moved above its 50-day SMA.
Overview
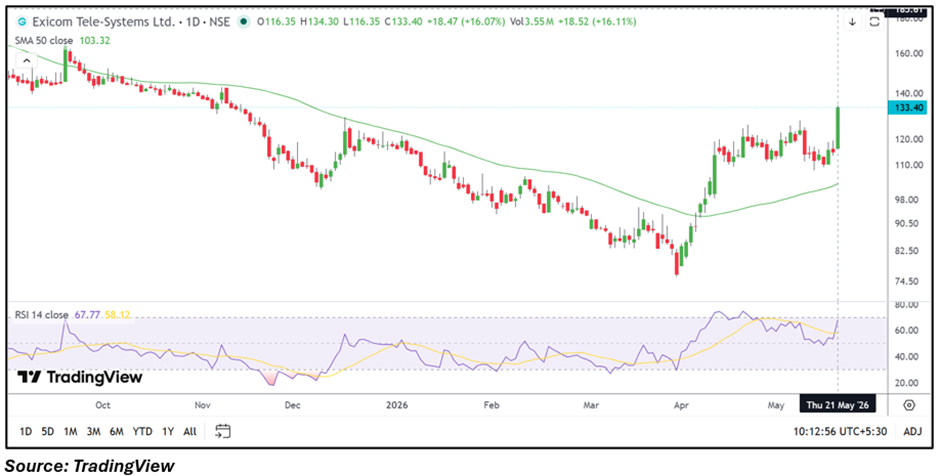
Exicom Tele-Systems Limited shares witnessed a sharp rally on May 21, with the stock climbing over 16% intraday to around ₹133.59. The counter also featured among the top gainers on the NSE during the session.
The rally followed the company’s March 2026 quarter earnings announcement released earlier this week. Exicom Tele-Systems reported standalone total income of ₹28,834.25 lakh for the quarter. Profit before tax stood at ₹1,605.42 lakh, while net profit came in at ₹1,190.39 lakh. Earnings per share for the quarter stood at ₹0.88.
The stock opened at ₹116.35 and touched an intraday high of ₹134.30 amid strong buying momentum and rising trading activity.
Fundamental View
Market participants are closely tracking Exicom Tele-Systems due to its presence in EV charging and power management solutions, sectors that continue to attract investor interest amid rising focus on electric mobility infrastructure.
The recent earnings update and strong price reaction have also brought the stock back into trader focus after a volatile trading phase seen over recent months.
Technical View
Exicom Tele-Systems stock is currently trading near ₹133.59 and has moved decisively above its 50-day SMA placed around ₹103.32, reflecting improvement in the near-term trend structure. Recent price action indicates a strong breakout move after the stock consolidated around the ₹110–₹120 zone in recent sessions.
The 14-day RSI has climbed near 67.77, suggesting strengthening momentum conditions. The momentum oscillator reflects accelerating price strength after the sharp rally, although the elevated RSI reading also points toward potential short-term volatility if profit-booking emerges near higher levels.
Key Technical Levels
On the downside, immediate support is placed near the ₹124–₹118 zone, which may act as an important short-term demand region. On the upside, resistance is seen around ₹141–₹149, where traders could monitor whether the current momentum sustains further.
Risks to Watch
- Sharp rallies may trigger profit-booking near resistance levels.
- Elevated volatility could increase short-term trading risks.
- EV infrastructure stocks remain sensitive to sector sentiment changes.
- Sustained earnings growth will remain important for valuation support.
Summary
Exicom Tele-Systems shares surged over 16% after the company reported March quarter earnings, with traders reacting positively to profitability and improving technical momentum. The stock has moved above its 50-day SMA while RSI levels indicate strengthening momentum conditions. Market participants are now watching whether the stock can sustain above the ₹124 support zone while attempting to test resistance near ₹141–₹149.
FAQs
- Why did Exicom Tele-Systems shares surge today?
The stock rallied after investors reacted positively to the company’s March 2026 quarter earnings and momentum-driven trading activity. - What are the key support levels for Exicom Tele-Systems stock?
Immediate support is placed near ₹124, followed by a broader support zone around ₹118. - What does the RSI indicate for EXICOM shares?
The RSI near 68 indicates strengthening momentum but also suggests elevated short-term volatility conditions.