
Highlights
- Lambodhara Textiles shares surged over 15% during Monday's session.
- The stock moved above its 21-day SMA after the latest earnings update.
- Strong price action pushed the stock among the top gainers on NSE.
Overview
Lambodhara Textiles Limited (NSE: LAMBODHARA) witnessed a sharp rally on June 1, with the stock gaining more than 15% and emerging among the top gainers on the NSE. The move followed the company's March 2026 quarter earnings announcement, with investors reacting positively to the latest financial update. The rally also helped the stock break above recent trading levels and improve its near-term technical structure.
Fundamental View
For the quarter ended March 2026, Lambodhara Textiles reported standalone total income of INR 5,829.41 lakh. Profit before tax stood at INR 219.72 lakh, while net profit came in at INR 312.92 lakh. Earnings per share for the quarter was reported at INR 3.02.
The latest results were announced on May 30, 2026. While the quarterly figures remained modest relative to larger textile peers, the market response indicates that investors are focusing on improving business performance and earnings visibility.
Technical View
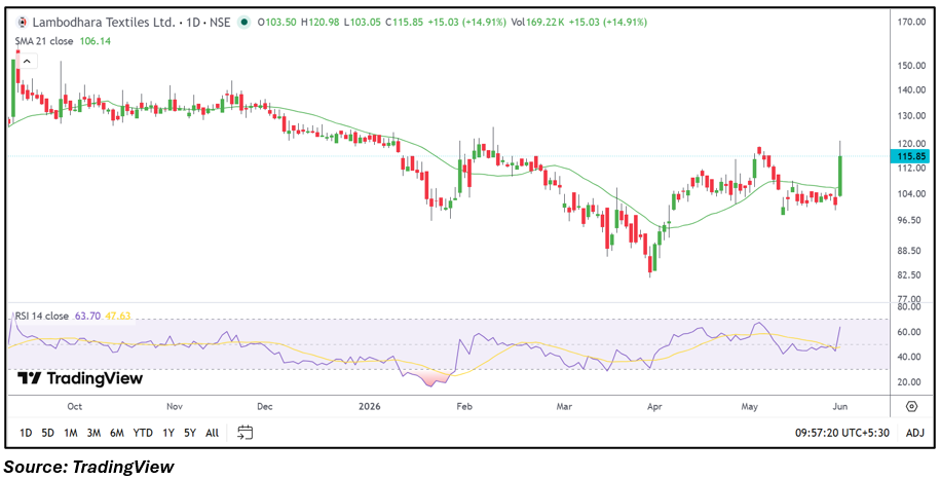
Lambodhara Textiles traded near INR 116.00 after a sharp intraday rally. The stock moved decisively above its 21-day SMA of INR 106.14, reflecting an improvement in the short-term trend. Recent price action indicates a breakout from the consolidation range that had persisted over the past several weeks. The 14-day RSI climbed to around 63.70, indicating strengthening momentum while remaining below extreme overbought territory. The sharp rise in volume alongside the price advance suggests heightened market participation.
Momentum Indicator
The RSI reading of 63.70 remains above the neutral 50 mark and reflects improving momentum conditions. A sustained reading above this zone may support continuation of the current recovery trend, although short-term volatility cannot be ruled out following the sharp rise.
Key Technical Levels
At the current market price of INR 116.00, immediate support is placed near INR 110.20, followed by a stronger support zone around INR 104.40. On the upside, immediate resistance is seen near INR 121.80, while the next major resistance level is positioned around INR 127.60. Sustaining above the recent breakout area could keep the stock in focus.
Risks to Watch
- Earnings growth may remain inconsistent across quarters.
- Lower liquidity can increase price volatility.
- Textile sector demand fluctuations may impact performance.
- Profit-booking may emerge after the sharp rally.
Summary
Lambodhara Textiles shares rallied sharply after the company's latest earnings announcement, helping the stock emerge among the top gainers on NSE. The move pushed the stock above its 21-day SMA and out of a recent consolidation range. While quarterly earnings remained relatively modest, the market responded positively to the update. Going forward, investors may monitor earnings consistency, demand trends, and whether the stock can sustain above its recent breakout zone.
FAQs
- Why did Lambodhara Textiles shares rise today?
The stock gained sharply following the company's March 2026 quarter earnings announcement and improved technical setup.
- What is the immediate support level for Lambodhara Textiles?
The first support level is around INR 110.20, followed by a stronger support zone near INR 104.40.
- What does the RSI indicate for the stock?
The RSI near 63.70 indicates improving momentum while remaining below extreme overbought conditions.