
Highlights
- MSTCLTD surged more than 13% and emerged among the top gainers on the NSE.
- The stock broke above a prolonged consolidation range and crossed key resistance levels.
- RSI moved into overbought territory, reflecting accelerating bullish momentum.
Overview
MSTC Limited (NSE: MSTCLTD) gained 13.58% to ₹507.10 on June 4, attracting significant market attention after a sharp breakout on the daily chart. The stock climbed above recent swing highs and extended its recovery from the March-April lows. The move comes shortly after the company reported profitable quarterly results, while traders appear to be focusing on the improving technical structure and renewed momentum.
Fundamental View
For the quarter ended March 2026, MSTC reported consolidated total income of INR 15,036.89 lakh. Profit before tax stood at INR 10,484.31 lakh, while net profit came in at INR 7,722.37 lakh. Earnings per share were reported at INR 10.97.
The latest results indicate that the company remained profitable during the quarter. The earnings performance has coincided with improving price action, helping support positive sentiment around the stock.
Technical View
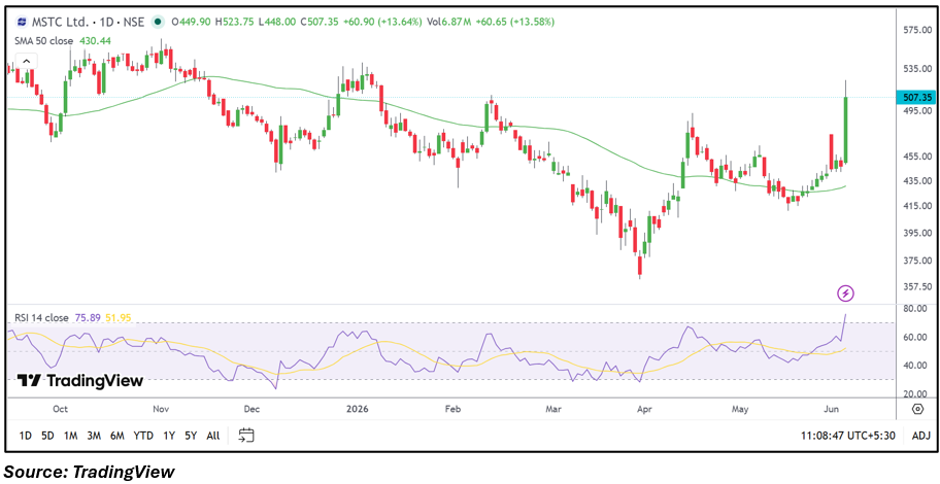
MSTCLTD is currently trading at ₹507.10, well above its 50-day SMA of ₹430.44, indicating a significantly improved near-term technical structure. Recent price action shows a decisive breakout from a multi-week consolidation zone, with the stock registering one of its strongest daily advances in recent months.
The 14-day RSI has climbed to 75.89, reflecting strong upward momentum. Although the indicator has entered overbought territory, it also confirms the strength behind the current breakout.
Momentum Indicator
Momentum has strengthened considerably, with RSI moving above the 75 mark and reaching its highest level in several weeks. The indicator suggests sustained upside participation and validates the breakout seen on the daily timeframe.
Key Technical Levels
The immediate support level is placed near ₹481.75. If the stock experiences a pullback, the next support zone is located around ₹456.40.
On the upside, the first resistance is seen near ₹532.45. A sustained move above this level could bring the next resistance area around ₹557.80 into focus.
Risks to Watch
- Overbought RSI may trigger short-term profit booking.
- Sharp rallies can lead to elevated volatility.
- Failure to sustain above breakout levels could weaken momentum.
- Broader market weakness may impact sentiment.
Summary
MSTC has emerged as one of the market's top gainers after breaking out above a prolonged consolidation range and moving decisively above its 50-day SMA. The company reported profitable quarterly results, while technical indicators have strengthened considerably. With RSI above 75 and momentum accelerating, traders will watch whether the stock can sustain above ₹500 while targeting higher resistance zones in the coming sessions.
FAQs
Why is MSTCLTD rising today?
The stock surged after a strong technical breakout above key resistance levels on the daily chart.
Is MSTCLTD trading above its 50-day SMA?
Yes, the stock is trading comfortably above its 50-day SMA of ₹430.44.
What are the important levels to watch?
Support is seen near ₹481.75 and ₹456.40, while resistance is located near ₹532.45 and ₹557.80.