
Highlights
- Eurotex Industries shares fell over 7% after a recent sharp rally.
- The stock remains above its 50-day SMA despite the latest correction.
- Loss-making financials and elevated volatility remain key concerns.
Overview
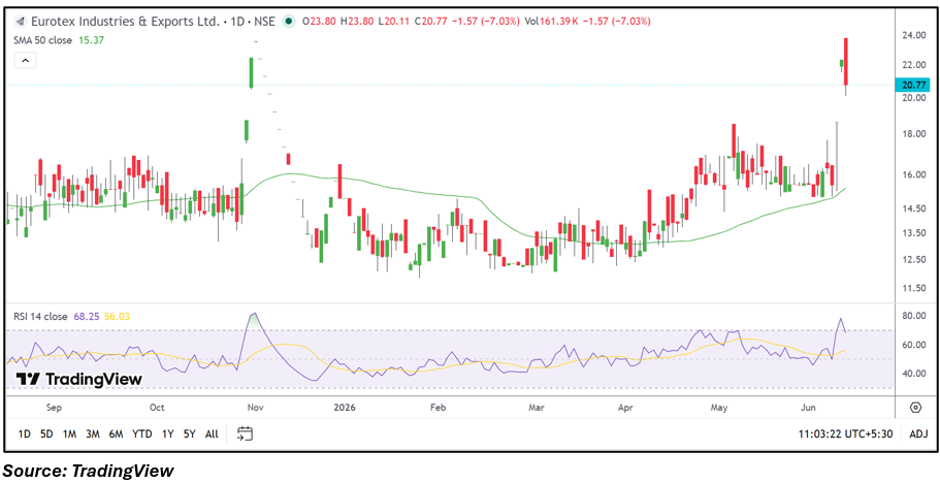
Eurotex Industries & Exports Limited (NSE: EUROTEXIND) came under selling pressure on June 11, with the stock declining 7.03% to ₹20.77. The fall follows a sharp rally that had pushed the stock near recent highs, triggering profit-booking activity. Despite the correction, the stock continues to trade above its 50-day moving average, keeping traders focused on whether the broader uptrend can remain intact.
Fundamental View
For the quarter ended March 2026, the company reported standalone total income of ₹43.19 lakh. Eurotex posted a loss before tax of ₹134.28 lakh and a net loss of ₹92.86 lakh. Earnings per share stood at negative ₹1.06.
The latest financial performance indicates that profitability remains a challenge. While the stock has witnessed sharp price movements recently, investors may continue monitoring operational performance and earnings visibility.
Technical View
Eurotex Industries is currently trading at ₹20.77, down 7.03% for the session, while remaining above its 50-day SMA of ₹15.37. The stock recently witnessed a sharp upward move before facing selling pressure near the ₹24 zone. The latest decline suggests short-term profit booking after a strong rally, though the broader price structure remains above its medium-term trend indicator.
Momentum Indicator
The 14-day RSI stands at 68.25, easing from recent higher levels but remaining close to the overbought zone. This indicates that momentum remains relatively elevated despite the latest pullback.
Key Technical Levels
Eurotex Industries has immediate support near ₹20.00, followed by a stronger support zone around ₹18.50. On the upside, resistance is visible near ₹23.80, while a sustained move above this level could open the door toward the ₹25.00 region.
Risks to Watch
- Continued losses in financial performance.
- Low liquidity due to limited market participation.
- Sharp volatility after recent price surge.
- Profit-booking pressure near recent highs.
Summary
Eurotex Industries remains on traders' radar after a sharp 7% decline following a recent rally. Although the stock continues to trade above its 50-day SMA, the latest correction highlights elevated volatility and profit-booking activity. With the company still reporting losses, investors may closely watch whether the stock can stabilize above key support zones while maintaining its broader recovery trend.
FAQs
- Why did Eurotex Industries shares fall today?
The stock witnessed profit booking after a recent rally, resulting in a decline of over 7%. - Is Eurotex Industries currently profitable?
No. The company reported a net loss of ₹92.86 lakh in the March 2026 quarter. - What is the key technical factor to watch?
Investors may watch whether the stock holds above its 50-day SMA and nearby support levels.