
Highlights
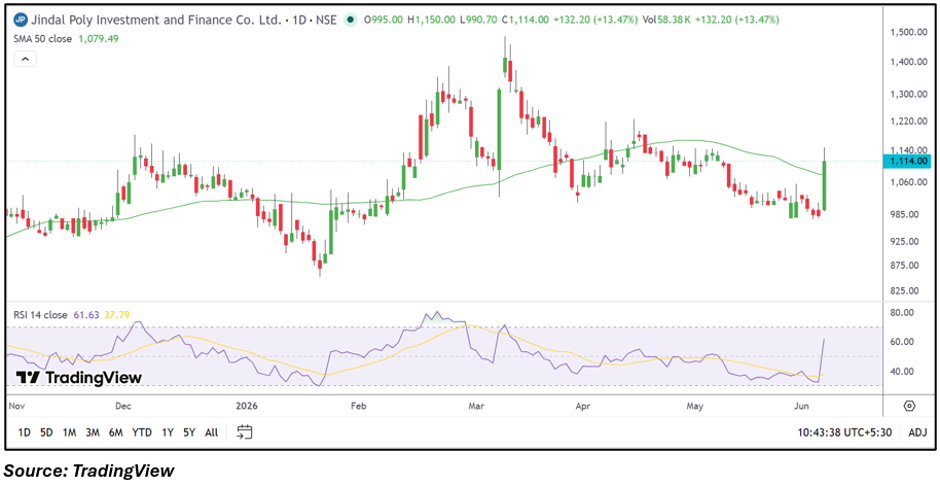
- JPOLYINVST shares surged 13.47% and emerged among the day's top gainers.
- The stock reclaimed its 50-day SMA and broke above a recent consolidation range.
- RSI strengthened to 61.63, indicating improving momentum on the daily chart.
Overview
Jindal Poly Investment and Finance Company (NSE: JPOLYINVST) attracted significant market attention on June 5 after its shares rallied 13.47% to ₹1,114.00. The stock witnessed a sharp upside move from an intraday low of ₹990.70 to a high of ₹1,150.00, supported by increased trading activity.
The breakout comes after several weeks of range-bound movement and has pushed the stock back above the psychologically important ₹1,100.00 level, making it one of the most actively watched gainers during the session.
Fundamental View
For the quarter ended March 2026, the company reported consolidated total income of ₹4,729.00 lakh. Profit before tax stood at ₹4,684.00 lakh, while net profit came in at ₹3,516.00 lakh. Earnings per share for the quarter were ₹33.45.
The latest results reflect continued profitability and provide a fundamental backdrop to the recent price recovery. Investors may continue monitoring earnings trends and the performance of the company's investment portfolio.
Technical View
JPOLYINVST is trading at ₹1,114.00, above its 50-day SMA of ₹1,079.49, indicating an improving near-term technical structure. On the daily chart, the stock has broken above a consolidation zone that had developed around ₹1,000.00–₹1,080.00 over recent weeks.
The sharp move above the moving average and prior resistance area suggests renewed momentum. The breakout also follows a period of lower highs and sideways movement, indicating that buyers have regained control in the near term.
Momentum Indicator
The 14-day RSI stands at 61.63, moving above its signal line and indicating strengthening momentum. The indicator remains below extreme overbought levels, suggesting room for further price movement if momentum continues.
Key Technical Levels
On the daily chart, immediate support is placed near ₹1,080.00, which coincides with the recent breakout area and the region around the 50-day SMA. A stronger support zone is visible near ₹1,000.00, where the stock spent several sessions consolidating before the latest rally. On the upside, immediate resistance is seen around ₹1,150.00, the day's high. A sustained move above this level could bring the ₹1,250.00 zone into focus, which marks the next significant resistance area on the chart.
Risks to Watch
- Profit booking after the sharp one-day rally.
- Failure to sustain above the breakout zone.
- Volatility in investment portfolio valuations.
- Broader market weakness affecting sentiment.
Summary
JPOLYINVST shares gained sharply after breaking above a key consolidation range and reclaiming the 50-day SMA on the daily chart. The stock's move above ₹1,100.00, coupled with an RSI reading of 61.63, reflects improving momentum. The company also reported profitable March 2026 quarterly results. Going forward, traders are likely to watch whether the stock can hold above its breakout zone and challenge the ₹1,150.00 resistance level.
FAQs
- Why is JPOLYINVST stock rising today?
The stock surged after breaking out of a consolidation range and moving back above its 50-day SMA.
- What does the RSI indicate for JPOLYINVST?
The RSI stands at 61.63, indicating improving momentum while remaining below overbought territory.
- What are the key levels to watch in JPOLYINVST?
Support is seen near ₹1,080.00 and ₹1,000.00, while resistance is located around ₹1,150.00 and ₹1,250.00.