
Highlights
- Viyash Scientific shares gained nearly 14% after the company announced Q4 earnings.
- The stock traded well above its 50-day SMA amid strong trading activity.
- Q4 consolidated net profit stood at INR 6,638 million for March 2026 quarter.
Overview
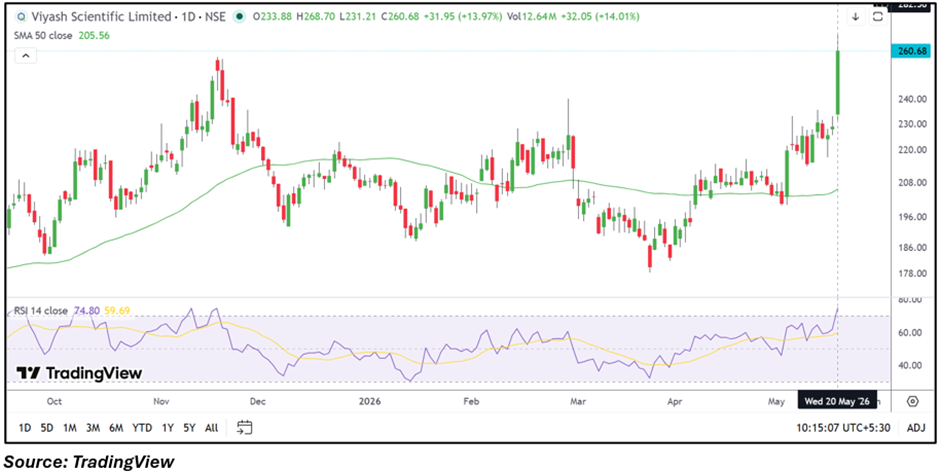
Viyash Scientific Limited (NSE: VIYASH) shares surged 13.98% to INR 260.70 on May 20, 2026, placing the stock among the top gainers on the NSE after the company announced its March quarter earnings.
The stock opened at INR 233.88 and touched an intraday high of INR 268.70 during the trading session. Trading volumes also increased sharply following the earnings announcement.
For the quarter ended March 2026, the company reported consolidated total income of INR 93,588 million. Profit before tax stood at INR 12,524 million, while net profit came at INR 6,638 million. Earnings per share for the quarter was reported at INR 1.20.
Fundamental View
Viyash Scientific operates in the pharmaceutical and healthcare-related segment, with business exposure linked to formulations, active pharmaceutical ingredients, and healthcare products.
The latest quarterly earnings update reflected improved profitability and triggered renewed market activity in the stock. Investors are likely to monitor revenue growth trends, margin movement, and sector demand in the coming quarters.
Technical View
Viyash Scientific is currently trading above its 50-day SMA near INR 205.56, reflecting an improved near-term structure after recent consolidation around lower levels. The sharp rally pushed the stock near fresh multi-month highs while indicating strong short-term momentum expansion.
The 14-day RSI climbed near 74.80 and moved above its signal line, reflecting elevated momentum conditions after the recent breakout move. The momentum oscillator also turned sharply higher from lower levels, indicating strengthening short-term price action and increased participation following the earnings update. However, the sharp rise in RSI also suggests stretched momentum conditions that may keep volatility elevated in the near term.
Key Technical Levels
Viyash Scientific has immediate support placed near INR 240, while the stronger support zone is seen around INR 220. On the upside, the stock may face immediate resistance near INR 385, followed by the INR 405 zone, which could remain important for further upside continuation in the near term.
Key Risks
- Regulatory changes may impact pharmaceutical sector sentiment.
- Elevated volatility may continue after the sharp rally.
- Margin pressure could affect future profitability trends.
- High valuation multiples may increase price fluctuations.
Summary
Viyash Scientific (NSE: VIYASH) witnessed a sharp rally after its March quarter earnings announcement, with the stock gaining nearly 14% during Wednesday’s trade. The stock has moved decisively above its 50-day SMA while RSI and momentum oscillators also strengthened notably. Traders may now monitor whether the stock sustains above the INR 240 zone, while resistance around INR 385–405 could remain important in the near term.
FAQs
- Why did Viyash Scientific shares rise today?
The stock rallied after the company announced its March 2026 quarterly earnings and improved profitability figures. - What is the support zone for VIYASH stock?
Immediate support is placed near INR 240, while stronger support is seen around INR 220. - What resistance levels should traders watch in Viyash Scientific?
The stock may face near-term resistance around INR 385 and the INR 405 zone.