
Highlights
- BLUECOAST declined nearly 5% and was locked at the lower circuit during the session.
- The stock is trading close to its 50-day SMA, reflecting a key technical juncture.
- Weak momentum and continued selling pressure remain key concerns for traders.
Overview
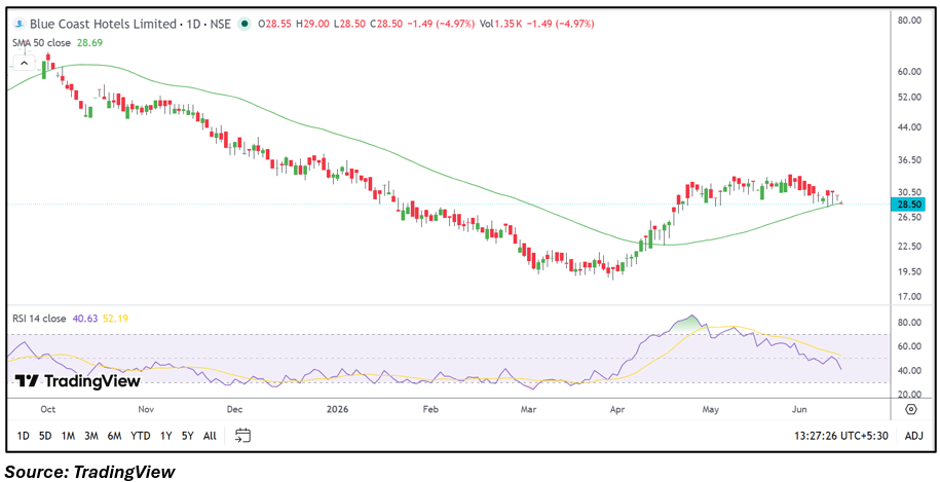
Blue Coast Hotels Limited (NSE: BLUECOAST) fell 4.97% to ₹28.50 on June 12, 2026, hitting its lower circuit limit. The decline comes even as the stock trades near its 50-day simple moving average (SMA), a level often monitored by traders to gauge trend direction. The latest move suggests market participants remain cautious despite the stock's recovery from its March lows.
Fundamental View
For the quarter ended March 2026, Blue Coast Hotels reported consolidated total income of INR 128.45 lakh. The company posted a loss before tax of INR 15.29 lakh and a net loss of INR 14.03 lakh, resulting in earnings per share of negative INR 0.14. The continued loss-making performance may be weighing on investor sentiment despite the stock's earlier recovery.
Technical View
BLUECOAST is currently trading at ₹28.50, down 4.97% in the session. The stock is hovering around its 50-day SMA of ₹28.69, making this an important level for traders. Price action shows that the stock recovered from its March lows but has struggled to sustain momentum above the ₹30 zone in recent weeks. RSI has slipped to around 41, indicating weakening momentum and reflecting the recent increase in selling pressure. A sustained move below the 50-day SMA could signal further consolidation in the near term.
Momentum Indicator
The RSI remains below the neutral 50 mark, suggesting momentum has weakened. Unless momentum improves, traders may remain cautious toward fresh upside attempts.
Key Technical Levels
At the current market price of ₹28.50, immediate support is seen around ₹27.08, followed by a stronger support zone near ₹25.65. On the upside, resistance is placed around ₹29.93, while the next hurdle is near ₹31.35. The stock needs to reclaim resistance levels to improve short-term sentiment, whereas a break below support could attract additional selling pressure.
Risks to Watch
- Continued losses in quarterly earnings.
- Weak trading volumes and liquidity.
- Regulatory restrictions under ESM surveillance.
- Breakdown below the 50-day moving average.
Summary
BLUECOAST has come under pressure despite trading close to its 50-day SMA, reflecting cautious sentiment and fading momentum. The stock remains at an important technical level where buyers and sellers are likely to battle for near-term direction. Investors may watch whether the stock can hold above its moving average or if further weakness emerges in the coming sessions.
FAQs
- Why did BLUECOAST fall 5% today?
The stock witnessed selling pressure and hit the lower circuit amid weakening momentum and cautious market sentiment.
- Is BLUECOAST still above its 50-day SMA?
The stock is trading very close to its 50-day SMA of ₹28.69, making it a key technical level.
- What are the key levels to watch?
Support is placed near ₹27.08 and ₹25.65, while resistance is seen around ₹29.93 and ₹31.35.