
Highlights
- D P Wires Limited (NSE: DPWIRES) surged 20.00% to ₹183.43.
- The stock hit its upper circuit after breaking above its 50-day SMA.
- D P Wires moved above the ₹180.00 mark for the first time in weeks.
- RSI climbed to 70.61, indicating strong short-term momentum.
- The company reported net profit of ₹339.36 lakh in the December 2025 quarter.
- Traders are now watching whether the rally extends toward the next higher zone.
Overview
D P Wires Limited (NSE: DPWIRES) was among the top gainers on April 10, 2026, after the stock rallied 20.00% to ₹183.43. The sharp move came after several weeks of consolidation and pushed the stock to its highest level in nearly two months.
The stock opened at ₹152.86, which was also the day’s low, and moved steadily higher through the session to touch an intraday high of ₹183.43. The strong move also resulted in the stock hitting its upper circuit.
Fundamental View
For the quarter ended December 2025, D P Wires Limited reported standalone total income of ₹9,713.84 lakh. Profit before tax came in at ₹432.53 lakh, while net profit stood at ₹339.36 lakh. Earnings per share for the quarter was ₹2.19.
The latest quarterly numbers indicate that the company remained profitable despite the broader volatility seen in smaller-cap industrial stocks during recent months.
Technical View
D P Wires Limited is currently trading near ₹183.43 and has moved decisively above its 50-day Simple Moving Average near ₹153.61. The breakout above the moving average is significant because the stock had remained below this level for most of February and March.
The chart shows that D P Wires had been forming a base in the ₹135.00–₹155.00 region after a prolonged decline from the September 2025 highs. The latest session changed the near-term structure sharply, with the stock breaking above the recent consolidation zone and closing at the day’s high.
Momentum has also strengthened considerably. The 14-day RSI is currently near 70.61, which places the indicator in the stronger momentum zone. Although such a sharp move may lead to some short-term consolidation, the overall structure has improved after the breakout.
The stock is now trading well above its recent average and has started to reverse the broader downtrend seen over the past few months. If D P Wires continues to hold above the breakout region, the recovery may extend further.
Key Technical Levels
On the downside, the immediate support zone is likely to remain between ₹170.00 and ₹155.00. Holding above this range may keep the recent rally intact.
On the upside, the next zone to watch is between ₹200.00 and ₹220.00. A move above ₹200.00 could strengthen the current upward momentum further.
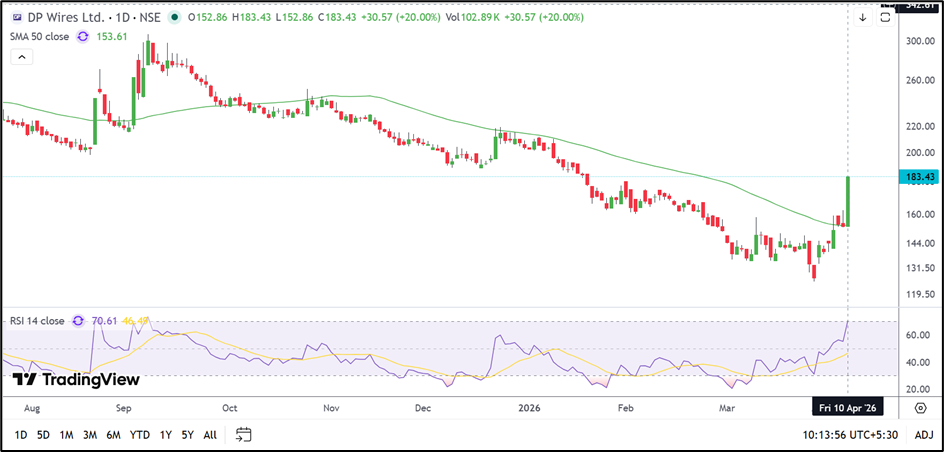
Source: TradingView
Risks To Watch
- The stock has rallied sharply in a single session and may witness profit-booking.
- RSI near 70.61 suggests the stock is entering an overheated zone.
- Failure to hold above the breakout region may weaken the recovery.
- Smaller-cap stocks often remain more volatile than the broader market.
Summary
D P Wires Limited (NSE: DPWIRES) saw a strong breakout after rising 20.00% and moving above its 50-day SMA. The chart structure has improved meaningfully, while momentum indicators also point toward stronger near-term sentiment. Traders may now watch whether the stock can sustain above ₹170.00 and continue its move toward higher levels.