
Highlights
- Delphi World Money shares declined nearly 9% amid renewed selling pressure.
- The stock continues to trade below its 50-day SMA, reflecting a weak trend.
- Recent quarterly results showed a net loss despite positive revenue generation.
Overview
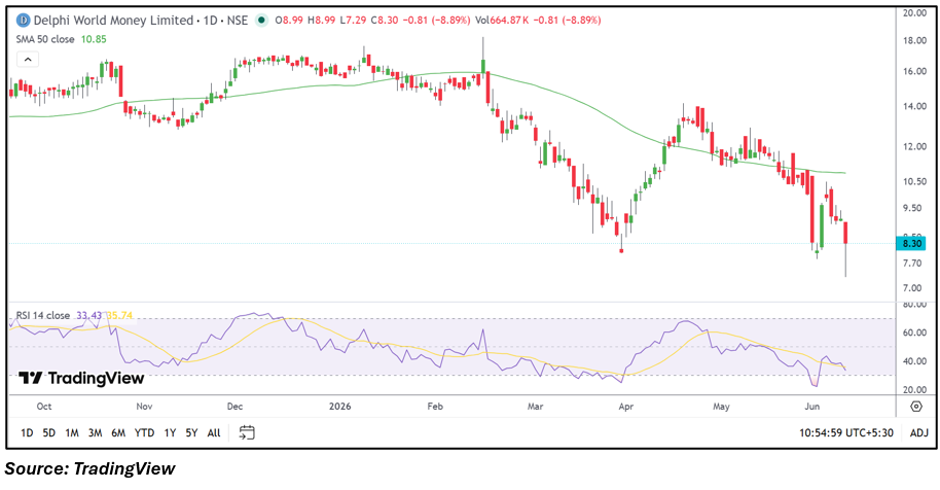
Delphi World Money (NSE: DELPHIFX) shares fell nearly 9% on June 10, with the stock trading around ₹8.30. The decline placed the counter among the day's notable losers as investors reacted to continued technical weakness and concerns surrounding earnings performance. The stock remains under pressure after failing to sustain recent recovery attempts, while broader sentiment has remained cautious.
Fundamental View
For the quarter ended March 2026, the company reported total income of ₹982.10 lakh. However, it posted a loss before tax of ₹20.90 lakh and a net loss of ₹177.70 lakh, translating into an EPS of -₹0.08. While revenue generation remained positive, the loss-making performance may continue to influence investor sentiment toward the stock.
Technical View
Delphi World Money is trading at ₹8.30, down 8.89% for the session. The stock remains below its 50-day SMA of ₹10.85, indicating that the broader price structure continues to favour the downside. Recent candles show persistent selling pressure after multiple failed rebound attempts. The RSI stands near 33.43, reflecting weak momentum and positioning close to the oversold zone. Unless the stock reclaims higher levels above its medium-term average, volatility may remain elevated.
Momentum Indicator
The 14-day RSI is around 33.43, remaining below the neutral 50 mark. This suggests momentum remains weak even though the stock is approaching oversold territory. A sustained recovery in RSI would be required to indicate an improvement in near-term sentiment.
Key Technical Levels
From a technical perspective, immediate support is placed near ₹7.89, followed by a stronger downside zone around ₹7.47. On the upside, the stock may face resistance near ₹8.72, while a stronger hurdle is visible around ₹9.13. A move above these resistance zones could improve the near-term setup, whereas a break below support levels may keep pressure on the stock.
Key Risks to Watch
- Continued losses may affect investor confidence.
- Trading below the 50-day SMA reflects trend weakness.
- ASM surveillance status could increase volatility.
- Low-priced stocks can witness sharp price swings.
Summary
Delphi World Money shares came under pressure as weak technical indicators and a loss-making quarterly performance weighed on sentiment. The stock remains below its 50-day SMA, while RSI readings indicate subdued momentum. Investors may closely watch whether the stock stabilizes near support levels or extends its recent decline. Sustained improvement in earnings and price action could be key factors for any meaningful recovery.
FAQs
- Why did Delphi World Money shares fall today?
The stock declined nearly 9% amid weak technical conditions and continued investor caution following recent financial results. - Is DELPHIFX trading above its 50-day SMA?
No, the stock is trading below its 50-day SMA of ₹10.85, indicating a weak medium-term trend. - What is the key factor investors should watch?
Investors may monitor earnings improvement, price stability near support levels, and whether the stock regains its 50-day SMA.