
Highlights
- Exxaro Tiles shares fell nearly 10% after a sharp rally in the previous session.
- The stock witnessed increased volatility as traders booked profits near recent highs.
- Despite the decline, EXXARO continues to trade above its 50-day SMA.
Overview
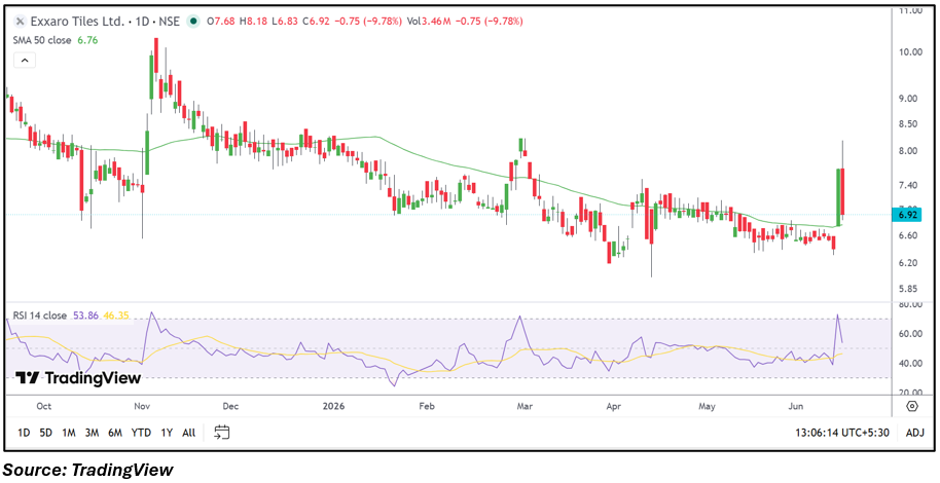
Exxaro Tiles (NSE: EXXARO) came under pressure on June 15, 2026, with the stock falling 9.78% to ₹6.92 after witnessing a strong rally in the previous trading session. The stock had surged into the market's top gainers list last week, attracting considerable trader interest, but selling pressure emerged as investors locked in gains.
The stock traded between ₹6.83 and ₹8.18 during the session, highlighting elevated volatility and active participation.
Fundamental View
For the quarter ended March 2026, Exxaro Tiles reported consolidated total income of ₹10,021.21 lakh. Profit before tax stood at ₹43.42 lakh, while net profit came in at ₹19.73 lakh. Earnings per share (EPS) remained at ₹0.00.
While the company remained profitable during the quarter, investors may continue monitoring earnings consistency, margins, and revenue growth trends in future results.
Technical View
Exxaro Tiles is currently trading at ₹6.92, down 9.78% during the session. Despite the sharp correction, the stock remains above its 50-day SMA of ₹6.76, indicating that the broader short-term structure has not completely weakened.
The recent rally pushed the stock sharply higher before today's decline erased a significant portion of those gains. The inability to sustain near the recent high of ₹8.18 suggests profit booking after a rapid advance. However, the stock continues to hold above an important moving-average reference point.
Momentum Indicator
The RSI is hovering around 54, easing from higher levels seen during the recent rally. While momentum has cooled, the indicator remains above the neutral zone, suggesting that traders are still monitoring the stock for directional cues.
Key Technical Levels
From the current price of ₹6.92, the 50-day SMA near ₹6.76 remains an important support area. Immediate support is seen around ₹6.80, followed by a stronger zone near ₹6.50. On the upside, resistance may emerge near ₹7.50, while a sustained move above that level could bring the recent high around ₹8.18 back into focus. The stock's ability to hold above its moving average will remain a key factor for traders.
Risks to Watch
- High valuation multiples may limit investor appetite.
- Sharp volatility can lead to rapid price swings.
- Profit booking may continue after the recent rally.
- Weak earnings growth could affect sentiment.
Summary
Exxaro Tiles witnessed a sharp reversal after last week's rally as traders booked profits near recent highs. Although the stock fell nearly 10%, it continues to trade above its 50-day SMA, keeping the broader near-term structure intact. Investors will be watching whether the stock can stabilize around current levels and regain momentum after the recent bout of volatility.
FAQs
Why did Exxaro Tiles shares fall today?
The decline appears linked to profit booking after the stock's sharp rally in the previous session.
Is EXXARO still trading above its 50-day SMA?
Yes, the stock remains above its 50-day SMA of approximately ₹6.76.
What is the next key area traders are watching?
Market participants are monitoring whether the stock can hold above support near the 50-day SMA and recover from the recent correction.