
Highlights
- Genesys International shares declined nearly 12% amid sharp intraday selling pressure.
- The stock slipped below short-term resistance levels after a failed recovery attempt.
- Weak momentum and volatility in high-beta technology counters weighed on sentiment.
Overview
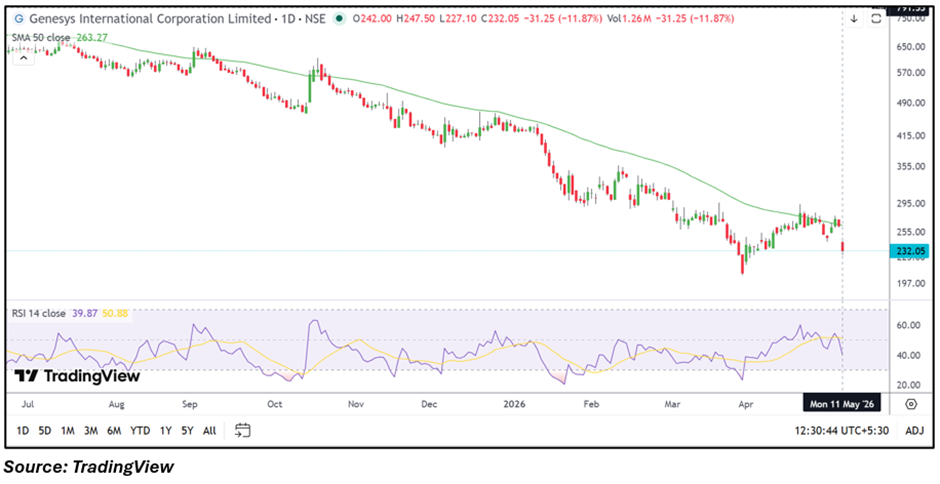
Genesys International Corporation Limited (NSE: GENESYS) came under significant pressure on May 11, with the stock falling 11.83% to around INR 232.15 during intraday trade. The sharp decline placed the stock among the top losers of the session as traders reacted to renewed weakness following a recent rebound attempt.
The stock opened lower at INR 242.00 and touched an intraday low of INR 227.10, reflecting aggressive selling activity throughout the session. Trading volumes also remained elevated compared to recent averages, highlighting increased market participation during the decline.
Fundamental View
Genesys International reported standalone total income of INR 7,776.33 lakh for the quarter ended December 2025. Profit before tax stood at INR 431.30 lakh, while net profit came in at INR 312.21 lakh with earnings per share at INR 0.75.
Despite the company remaining profitable, the stock has witnessed heightened volatility in recent months due to valuation concerns and sharp price swings across technology-linked midcap counters. Market participants appear cautious as investors reassess earnings visibility and near-term growth expectations.
Technical View
Genesys International is trading below its 50-day simple moving average near INR 263.27, indicating a weak near-term structure. The latest decline erased a large part of the recent recovery move and pushed the stock back toward lower trading zones.
The 14-day RSI slipped near 39.87, reflecting fading momentum after earlier recovery attempts. Price action suggests that sellers regained control after the stock failed to sustain above higher resistance levels during recent sessions.
Momentum Indicator
The stock has witnessed elevated volatility over the last six months, with sharp swings on both sides. Momentum indicators currently suggest weakening price strength as intraday selling accelerated near resistance areas.
Key Technical Levels
- Immediate support is placed around INR 215–200.
- Fresh downside pressure may emerge if the stock slips below INR 215.
- Immediate resistance is seen near INR 250–265.
- Sustained recovery above INR 265 may improve near-term sentiment.
Risk to Watch
- Genesys International faces elevated volatility due to sharp price fluctuations.
- Weak market sentiment may pressure high-beta technology stocks further.
- Failure to hold support zones may trigger additional selling activity.
- Lower earnings visibility could affect near-term investor confidence.
Summary
Genesys International shares witnessed a sharp correction as renewed selling pressure emerged after a recent recovery attempt. The stock remains below its 50-day SMA, while momentum indicators indicate weakening strength in the near term. Elevated volatility, resistance near higher levels, and cautious sentiment toward high-beta technology counters remain key factors influencing price action. Investors may closely monitor support around INR 215–200 and resistance near INR 250–265 for further directional cues.
FAQs
Why did Genesys International shares fall sharply today?
The stock declined due to heavy selling pressure, weak momentum, and cautious sentiment in volatile technology counters.
What are the important support levels for GENESYS stock?
Immediate support is placed around INR 215–200 based on current price structure and recent trading activity.
What resistance levels should investors monitor now?
Key resistance for Genesys International is placed near INR 250–265 in the short term.