
Highlights
- Hinduja Global Solutions shares jumped more than 15% during Wednesday's session.
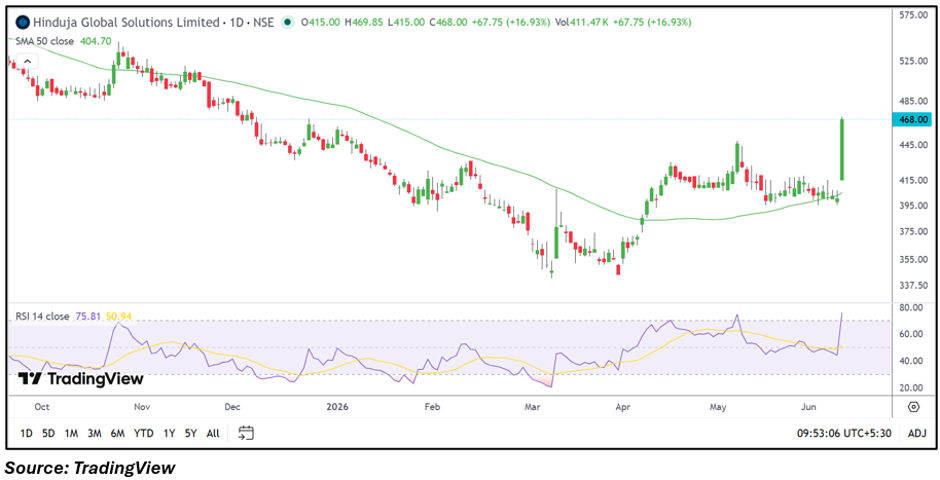
- The stock surged above its 50-day SMA, indicating improving near-term momentum.
- Strong price action pushed RSI into the overbought zone amid increased market activity.
Overview
Hinduja Global Solutions (NSE: HGS) emerged among the top gainers on June 10, with the stock rising 15.48% to ₹468.00. The sharp move came after the stock opened at ₹415.00 and climbed to an intraday high of ₹467.95. The rally also pushed the stock well above its 50-day simple moving average, attracting attention from market participants.
Despite the latest surge, the company's recent quarterly results showed a consolidated net loss of ₹1,358 lakh on total income of ₹1,25,463 lakh for the quarter ended March 2026.
Fundamental View
Hinduja Global Solutions operates in the business process management and digital transformation space. While the company reported substantial revenue during the latest quarter, profitability remained under pressure as reflected in the reported net loss. Investors may continue monitoring future earnings performance, margin trends, and business growth initiatives to assess whether operational performance improves in upcoming quarters.
Technical View
HGS is currently trading at ₹468.00, up 15.48% in the session and comfortably above its 50-day SMA of ₹404.70. The stock had been consolidating around the ₹400 region before witnessing a sharp breakout. The latest move indicates renewed bullish momentum, with price action reaching its highest level in several weeks. Meanwhile, the RSI climbed sharply to 75.81, reflecting strong momentum after the breakout.
Momentum Indicator
The 14-day RSI stands at 75.81, compared with its signal line near 50.94. The indicator has moved into overbought territory, highlighting accelerating momentum but also suggesting the possibility of higher short-term volatility following the recent rally.
Key Technical Levels
HGS has reclaimed its 50-day SMA and established a strong upward move above the ₹400 zone. Immediate support is now seen near ₹440.00, while a stronger support area is positioned around ₹405.00. On the upside, resistance may emerge near ₹475.00, followed by a higher hurdle around ₹500.00 if momentum remains intact.
Key Risks to Watch
- Recent quarterly net loss may weigh on sentiment.
- Elevated RSI may increase short-term volatility.
- Failure to sustain above breakout levels could trigger profit booking.
- Earnings recovery remains an important factor for valuations.
Summary
Hinduja Global Solutions shares surged more than 15% after breaking out above a prolonged consolidation range and moving decisively above the 50-day SMA. The technical structure has improved significantly, supported by strong momentum readings. However, investors may continue monitoring earnings performance and whether the stock can sustain gains after the sharp rally.
FAQs
- Why did HGS shares rise today?
The stock rallied after a strong technical breakout above consolidation levels and its 50-day SMA. - What were HGS's latest quarterly results?
The company reported total income of ₹1,25,463 lakh and a net loss of ₹1,358 lakh for March 2026. - Is HGS technically bullish now?
The stock is trading above its 50-day SMA with RSI above 75, indicating strong momentum but elevated volatility.