
Highlights
- Hyundai Motor India shares declined 3.21% during Wednesday’s trading session.
- December quarter standalone net profit stood at INR 1,19,492.30 lakh.
- The stock extended its decline after slipping below INR 1,800.00.
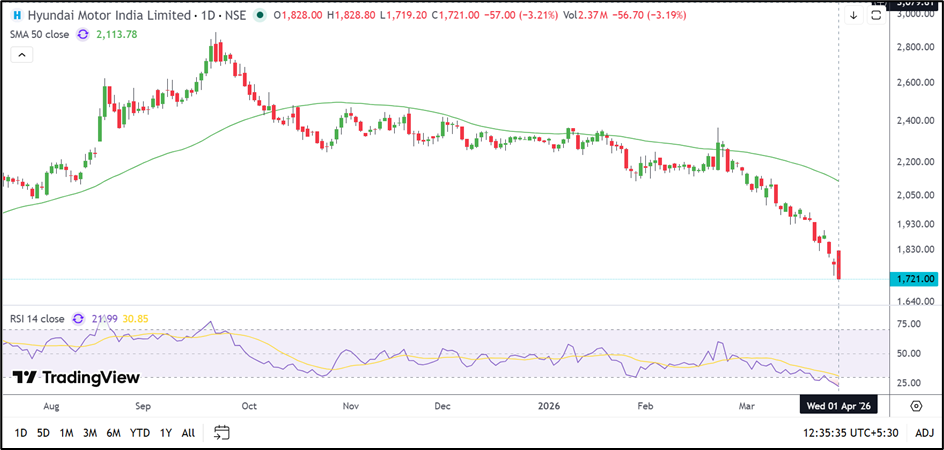
Hyundai Motor India (NSE: HYUNDAI) declined on 1 April 2026, with the stock trading near INR 1,721.00, down 3.21% from its previous close of INR 1,778.00. The stock opened at INR 1,828.00 and touched an intraday high of INR 1,828.80 before falling to a low of INR 1,719.20. VWAP for the session was recorded at INR 1,758.65.
The latest decline came as the stock continued to weaken below the INR 1,800.00 zone. Hyundai Motor India (NSE: HYUNDAI) also remains below its 50-day Simple Moving Average near INR 2,113.78, indicating that the broader structure continues to stay weak.
Fundamental View: December Quarter Earnings Stay Strong
For the quarter ended 31 December 2025, Hyundai Motor India (NSE: HYUNDAI) reported standalone total income of INR 17,68,903.30 lakh. Profit before tax stood at INR 1,61,199.60 lakh, while net profit came in at INR 1,19,492.30 lakh. Earnings per share for the quarter was reported at INR 14.71.
Although the company remained profitable during the quarter, the recent decline in the share price suggests that investors are focusing more on the weak technical structure and softer sentiment in the auto sector.
Technical View: Selling Pressure Deepens Below 50-Day Average
Hyundai Motor India (NSE: HYUNDAI) is currently trading near INR 1,721.00 and remains well below its 50-day Simple Moving Average near INR 2,113.78. The chart continues to show a sequence of lower highs and lower lows, reflecting an ongoing correction phase.
The recent slide below INR 1,800.00 has increased downside pressure, while the stock is now approaching the lower end of its recent range. The broader structure suggests that any recovery may remain limited unless the stock reclaims the INR 1,900.00 zone.
Momentum Indicator Signals Deep Weakness
The 14-day RSI has dropped to around 21.99, indicating that the stock has entered oversold territory. This may support short-term stabilisation, although momentum remains weak.
Key Technical Levels
At INR 1,721.00, immediate support is seen near INR 1,600.00, followed by stronger downside support around INR 1,500.00. On the upside, resistance is placed near INR 1,900.00–2,000.00.
Source: TradingView
Key Risks
- Failure to hold above INR 1,600.00 may deepen the decline.
- Resistance near INR 1,900.00–2,000.00 may restrict recovery.
- Weak auto sector sentiment may pressure the stock.
- Momentum remains weak below the 50-day average.
Summary
Hyundai Motor India (NSE: HYUNDAI) shares declined 3.21% to INR 1,721.00 after extending their recent correction. The stock remains below its 50-day moving average near INR 2,113.78, while RSI near 21.99 signals oversold conditions. Investors are likely to watch whether support near INR 1,600.00 can hold.
FAQs
- Why did Hyundai Motor India shares fall today?
The stock weakened after slipping below INR 1,800.00. - What was Hyundai Motor India’s December quarter net profit?
The company reported standalone net profit of INR 1,19,492.30 lakh. - Which levels are important for Hyundai Motor India shares now?
Support is near INR 1,600.00–1,500.00, while resistance stands near INR 1,900.00–2,000.00.