
Highlights
- InfoBeans Technologies declined over 5% amid renewed selling pressure.
- The stock slipped below a recent consolidation zone after failing to sustain higher levels.
- Technical indicators suggest weakening momentum despite healthy quarterly profitability.
Overview
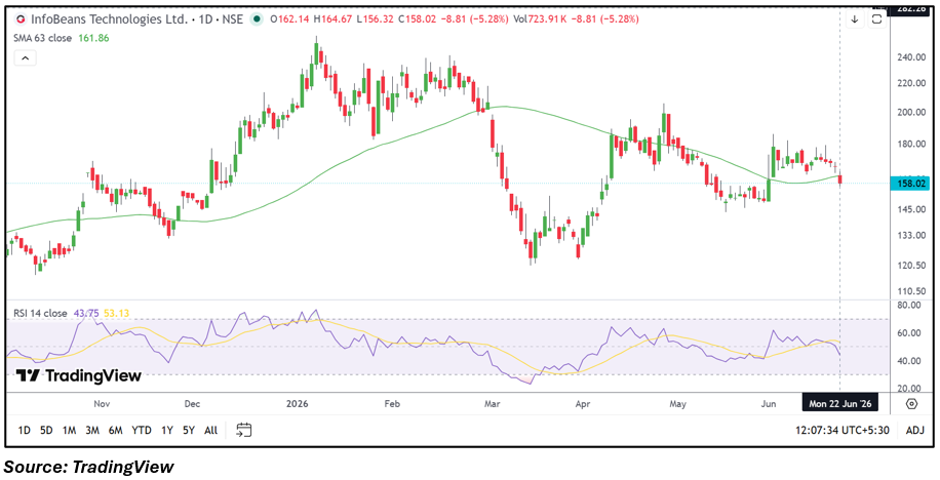
InfoBeans Technologies Limited (NSE: INFOBEAN) witnessed notable selling pressure on June 22, with the stock falling 5.28% to ₹158.02. The decline came after a prolonged consolidation phase near the ₹165–₹175 range, where the stock struggled to build fresh upward momentum. Increased volatility and profit booking emerged as the stock moved below its recent trading band, drawing attention from market participants.
Fundamental View
For the quarter ended March 2026, InfoBeans reported standalone total income of ₹11,288.00 lakh. Profit before tax stood at ₹2,425.00 lakh, while net profit came in at ₹1,925.00 lakh. Earnings per share were reported at ₹1.98. The financial performance reflects continued profitability; however, the current market reaction appears to be driven more by technical factors and near-term sentiment rather than fresh fundamental developments.
Technical View
The stock has been consolidating for several weeks after witnessing significant volatility during the past year. Recent price action shows rejection near higher levels, followed by a breakdown from the consolidation range. The stock is now trading below its 63-day moving average of ₹161.86, indicating a deterioration in short-term trend strength. Meanwhile, the RSI has slipped to around 43.75, suggesting momentum has weakened and shifted closer to the bearish side of the neutral zone.
Key Technical Levels
The immediate support zone is placed near ₹156.00, followed by a stronger support area around ₹145.00. On the upside, resistance is likely to emerge near ₹165.00, while a decisive move above ₹175.00 could improve near-term sentiment and potentially trigger renewed buying interest.
Risks To Watch
- Breakdown below ₹156.00 may increase downside pressure.
- Weak momentum readings could limit recovery attempts.
- Elevated volatility may result in sharp price swings.
- Failure to reclaim resistance levels may delay trend reversal.
Summary
InfoBeans Technologies shares declined more than 5% after failing to sustain momentum following a recent consolidation phase. While the company remains profitable based on its latest quarterly results, the stock has moved below a key technical zone and is showing signs of weakening momentum. Market participants may closely watch support near ₹156.00 and resistance around ₹165.00 for indications of the next directional move.
FAQ
Why did InfoBeans Technologies shares fall today?
The stock witnessed profit booking and broke below its recent consolidation range, leading to increased selling pressure.
Are the company's fundamentals weakening?
The latest quarterly results remained profitable, indicating the current decline is primarily driven by technical factors.
What levels should traders monitor?
Support is near ₹156.00 and ₹145.00, while resistance is located around ₹165.00 and ₹175.00.