
Highlights
- The stock surged 19.99% to hit the upper circuit limit.
- Short-term returns significantly outperformed NIFTY 50 benchmark.
- Technical indicators show strong momentum with overbought signals.
Shares of Jinkushal Industries Limited (NSE:JKIPL) were trading at ₹78.80 as of April 15, 2026, registering a gain of ₹13.13 or 19.99%, hitting the upper circuit. The stock opened at ₹76.19 and moved to an intraday high of ₹78.80, while the low stood at ₹73.00, indicating sustained buying throughout the session.
The previous close was ₹65.67, and the VWAP stood at ₹77.45. The stock has shown significant short-term price movement, including gains exceeding 25% over the past 15 days.
Returns Compared to Benchmark
Jinkushal Industries Limited has delivered higher returns compared to the NIFTY 50 in the short term. Over the past week, the stock gained 44.03% compared to 0.93% for the index.
Monthly returns stand at 42.60%, significantly higher than the index return of 4.62%. On a year-to-date basis, the stock declined 13.18%, compared to a fall of 7.36% in the benchmark.
Data for one-year and longer-term periods remains limited, while the benchmark shows steady gains across these timeframes.
Financial Performance Snapshot
For the quarter ended December 31, 2025, standalone total income stood at ₹9,179.17 lakh. Profit before tax was ₹570.60 lakh, while net profit came in at ₹417.01 lakh. Earnings per share (EPS) was ₹1.09.
On a consolidated basis, total income stood at ₹4,536.15 lakh. The company reported a loss, with profit before tax at ₹-833.60 lakh and net loss at ₹-987.19 lakh. EPS stood at ₹-2.21.
These figures are based on unaudited financial results released in February 2026.
Technical Indicators and Momentum
The stock has surged above its 21-day simple moving average near ₹54.48, indicating a strong breakout. It formed a base around ₹48.00 before initiating a sharp upward move.
The 14-day RSI stands at 76.08, placing it in the overbought zone and reflecting strong momentum. Immediate support is seen in the ₹ 72-67 range, while resistance is expected near ₹ 85-90 levels.
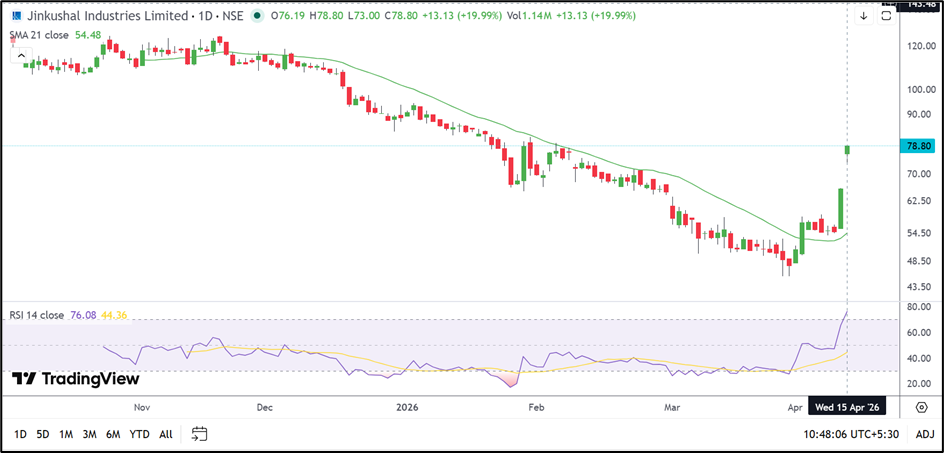
Source: TradingView
Trading and Volatility Indicators
The company has a total market capitalisation of ₹302.48 crore and a free float market cap of ₹75.64 crore. Traded volume during the session was 11.49 lakh shares, translating into a traded value of ₹8.90 crore.
Impact cost stands at 0.55, indicating moderate liquidity. Daily volatility is recorded at 2.95%, while annualised volatility stands at 56.36%, reflecting notable price fluctuations.
The deliverable quantity stands at 48.24% of traded volume, indicating balanced participation between delivery and intraday trades.
Key Risks
- Overbought technical indicators may lead to short-term correction.
- Consolidated losses indicate financial inconsistency.
- High volatility may result in sharp price movements.
- Limited long-term data may affect investment assessment.
Summary
Jinkushal Industries Limited shares surged to hit the upper circuit, supported by strong short-term momentum and a technical breakout above key levels. The stock has significantly outperformed the NIFTY 50 in recent periods, though year-to-date performance remains negative. Financial data reflects mixed profitability across segments. Technical indicators suggest elevated momentum with potential for near-term consolidation.
FAQs
- Why did Jinkushal Industries stock hit the upper circuit?
The stock surged nearly 20% due to strong buying momentum and a breakout above key technical levels. - What do technical indicators suggest for Jinkushal stock?
Indicators show overbought conditions with strong momentum, suggesting possible short-term consolidation or pullback. - How has Jinkushal performed compared to NIFTY 50?
It has significantly outperformed in the short term but shows limited data for longer-term comparison.