
Highlights
- OCCL shares surged 20.00% and hit the upper circuit after the latest Q4FY26 results.
- Net profit for the March quarter stood at INR 1,934.83 lakh on improved revenue performance.
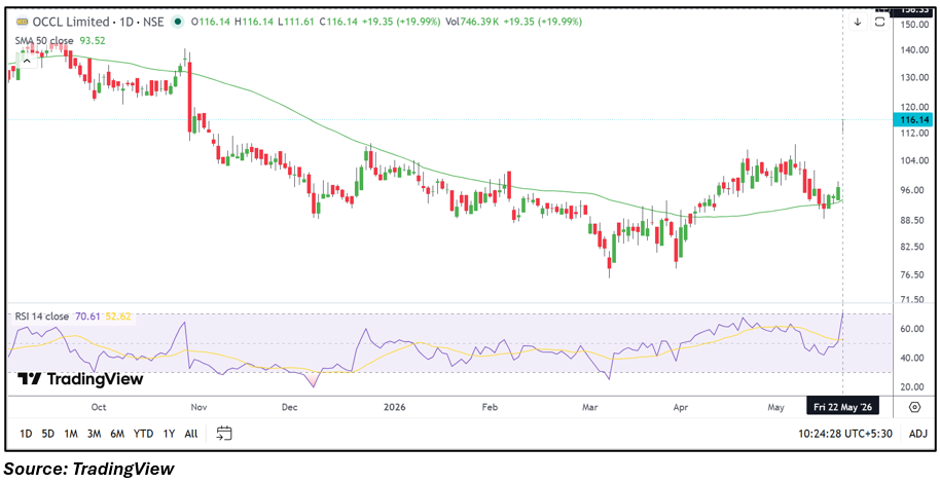
- The stock moved sharply above its 50-day SMA with RSI entering the overbought zone.
Overview
OCCL Limited (NSE: OCCLLTD) witnessed strong buying activity on May 22, 2026, with the stock locked at its 20.00% upper circuit near INR 116.14. The sharp rally followed the company’s latest quarterly earnings announcement, which drew investor attention due to improved profitability and earnings performance.
Trading volumes also rose significantly during the session, indicating heightened market participation after the Q4FY26 update.
Fundamental View
For the quarter ended March 2026, the company reported standalone total income of INR 14,953.30 lakh. Profit before tax stood at INR 1,708.05 lakh, while net profit came in at INR 1,934.83 lakh. Earnings per share for the quarter were reported at INR 3.87.
The latest financial performance appears to have improved sentiment around the stock, especially after a prolonged phase of subdued price action seen over recent months.
Technical View
The stock is currently trading near INR 116.14, significantly above its 50-day SMA placed around INR 93.52, reflecting a positive near-term structure. The sharp upward move also pushed the stock toward fresh short-term highs with expanded volumes.
The 14-day RSI has climbed near 70.61, indicating stronger momentum conditions while also suggesting the stock has entered the overbought region in the near term. Sustained movement above recent breakout levels may keep volatility elevated during upcoming sessions.
Momentum Indicator
Momentum indicators strengthened sharply after the earnings-driven rally. RSI moved decisively above the neutral zone, while price action reclaimed levels above the 50-day moving average. The latest breakout also reflects renewed market interest after recent consolidation near lower levels.
Key Technical Levels
Immediate support is placed around the INR 103.00-95.00 zone, which could act as an important area for short-term stability during any pullback. On the upside, resistance is expected near INR 130.00-145.00, where traders may monitor profit-booking or fresh breakout attempts.
Risks to Watch
- RSI near overbought levels could trigger short-term volatility.
- Sharp rallies may attract profit-booking pressure at higher levels.
- Sustaining volume momentum remains important after the breakout.
- Broader market weakness could impact near-term sentiment.
Summary
OCCL shares surged to the upper circuit after the company reported its latest quarterly earnings, with investors reacting positively to profitability and earnings performance. The stock moved above its 50-day SMA and momentum indicators strengthened sharply. While near-term sentiment has improved, resistance near INR 130.00-145.00 and elevated volatility remain key factors to monitor.
FAQs
- Why did OCCL shares hit upper circuit today?
The stock rallied after the company reported improved quarterly profit and revenue figures. - What are the important support levels for OCCL stock?
Immediate support is placed near the INR 103.00-95.00 zone based on recent price structure. - What resistance levels should traders watch now?
The next resistance area for OCCL shares is placed around INR 130.00-145.00.