
Highlights
- Osia Hyper Retail shares declined nearly 5% after a short-term recovery attempt.
- Stock continued trading below its 50-day SMA, reflecting a weak broader structure.
- RSI cooled toward neutral levels as momentum faded near resistance zones.
Overview
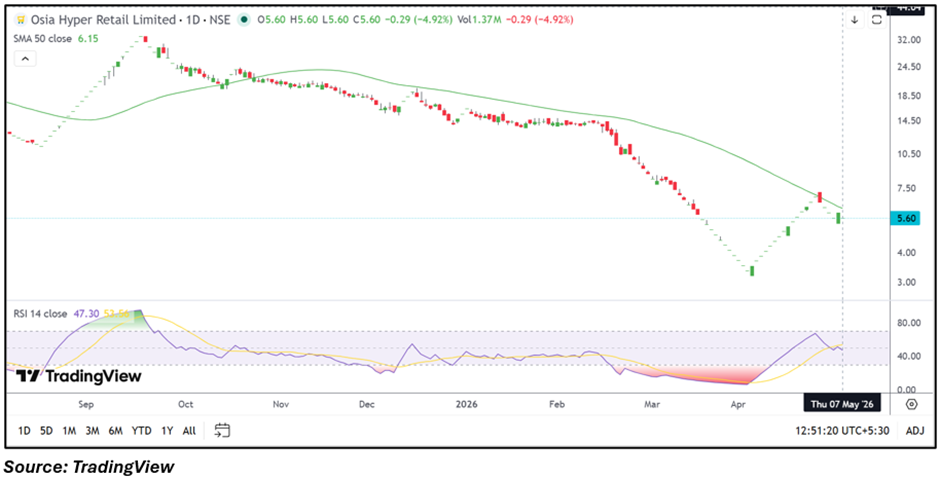
Osia Hyper Retail (NSE: OSIAHYPER) fell 4.92% on May 7, 2026, trading near ₹5.60 during the session after witnessing renewed selling pressure. The stock opened at ₹5.60 against the previous close of ₹5.89 and remained under pressure through the trading day.
The decline came after a recent rebound from lower levels near ₹3–₹4 seen in April. However, the stock failed to sustain momentum near higher levels, leading to another pullback as traders monitored near-term resistance zones.
Fundamental View
For the quarter ended December 31, 2025, Osia Hyper Retail reported standalone total income of INR 38,357.74 lakh. Profit before tax stood at INR 576.77 lakh, while net profit came at INR 431.60 lakh. Earnings per share for the quarter was reported at INR 0.24.
Market participants continue tracking retail demand conditions, store expansion activity, working capital management, and profitability trends within the organized retail segment.
Technical View
Osia Hyper Retail is trading near ₹5.60, down 4.92%, and remains below its 50-day SMA around ₹6.15, indicating that the broader near-term structure continues to stay weak despite the recent rebound attempt.
Price action reflects a pullback after the stock failed to sustain above recent recovery levels near ₹6.00. Volatility also remained elevated during the session as the stock traded near short-term support zones.
The 14-day RSI is hovering near 47.30, suggesting momentum has moderated and moved closer to neutral territory after cooling from higher levels seen during the rebound phase.
Momentum Indicator
The RSI has slipped below the 50 zone, indicating weakening short-term momentum after the recent recovery attempt. Traders may continue monitoring whether the stock stabilizes near support levels.
Key Technical Levels
- Immediate Support: ₹5.00
- Secondary Support: ₹4.60
- Immediate Resistance: ₹6.10
- Higher Resistance: ₹6.60
Risks To Watch
- Sustained trading below the 50-day SMA may weaken sentiment.
- Failure to hold ₹5 support can increase downside pressure.
- Retail demand slowdown may affect revenue visibility.
- Elevated volatility may continue in low-priced stocks.
Summary
Osia Hyper Retail shares slipped after failing to sustain recent recovery momentum near higher resistance zones. The stock continues to trade below its 50-day SMA, reflecting a weaker near-term technical structure despite the rebound seen in previous weeks. Traders may continue monitoring support near ₹5.00 and resistance around ₹6.10–₹6.60 for further directional cues.
FAQs
Why did Osia Hyper Retail shares decline today?
The stock witnessed renewed selling pressure after failing to sustain its recent recovery momentum.
What are the important support levels for OSIAHYPER?
Immediate support is placed near ₹5.00, while the next important support zone is around ₹4.60.
Why is RSI important for Osia Hyper Retail currently?
RSI near 47 indicates moderating momentum and reflects weakening short-term price strength.