
Highlights
- Reliance Infrastructure shares declined 5% and hit the lower circuit on June 15.
- The stock came under pressure after a recent recovery attempt from multi-month lows.
- Price remains below the 50-day SMA, indicating the broader trend is still cautious.
Overview
Reliance Infrastructure (NSE: RELINFRA) was among the stocks under pressure on June 15, 2026, with the share price falling 5.00% to ₹81.55 and locking into the lower circuit. The decline came after the stock had staged a recovery from its recent lows, prompting traders to book profits amid weak market sentiment.
The stock opened at ₹81.55 and remained at the same level throughout the session, indicating persistent selling pressure. Reliance Infrastructure currently trades in the BE segment, where intraday trading restrictions can sometimes amplify price movements.
Fundamental View
For the quarter ended March 2026, Reliance Infrastructure reported consolidated total income of ₹4,15,434 lakh. The company reported a profit after tax of ₹1,64,015 lakh, while earnings per share stood at ₹22.47.
While the latest financial performance reflected profitability, market participants continue to monitor the company's debt profile, project execution, regulatory developments, and infrastructure sector conditions, which can influence sentiment toward the stock.
Technical View
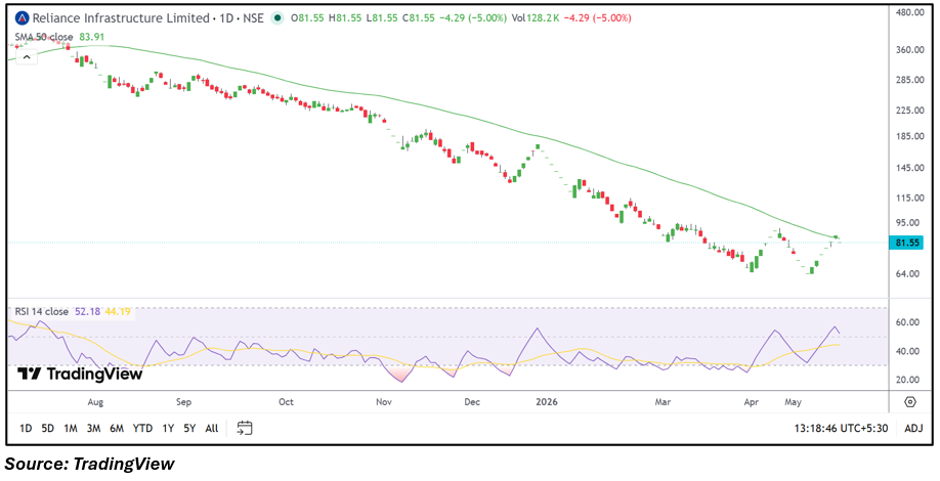
Reliance Infrastructure is trading at ₹81.55, down 5.00% during the session. The stock remains below its 50-day SMA of ₹83.91, suggesting that the broader trend has yet to turn decisively positive. Price had recently rebounded from lower levels but faced renewed selling pressure near the moving average, resulting in a sharp decline.
The RSI (14) stands near 52.18, indicating neutral momentum. While the stock has recovered from its lows seen earlier in the year, traders may look for sustained movement above the 50-day SMA before confirming any stronger trend improvement.
Momentum Indicator
The RSI has moved above the 50 mark and remains in neutral territory. This suggests momentum has improved compared to earlier months, although the latest lower-circuit move reflects short-term weakness and increased volatility.
Key Technical Levels
From the current price of ₹81.55, immediate support is placed near ₹77.47, while a deeper support zone is seen around ₹73.40. On the upside, the stock may face resistance near ₹85.63, followed by a higher resistance zone around ₹89.71. A sustained move beyond these levels could influence the next directional trend.
Risks to Watch
- High volatility due to circuit-filter restrictions.
- Infrastructure project execution delays.
- Regulatory and legal developments.
- Weak market sentiment toward leveraged companies.
Summary
Reliance Infrastructure shares hit the lower circuit on June 15 as selling pressure emerged following a recent rebound attempt. Although the company reported profitability in the March 2026 quarter, the stock continues to trade below its 50-day SMA, indicating that technical caution remains. Traders are likely to monitor whether the stock can stabilize above nearby support zones and regain momentum in the coming sessions.
FAQs
- Why did Reliance Infrastructure hit the lower circuit today?
The stock witnessed heavy selling pressure and declined 5%, resulting in a lower circuit move.
- Is Reliance Infrastructure trading above its 50-day SMA?
No, the stock is currently trading below its 50-day SMA of ₹83.91.
- What are investors watching in Reliance Infrastructure?
Investors are monitoring earnings performance, debt levels, project execution, and technical price trends.