
Highlights
- RKEC Projects shares declined nearly 10% and slipped to a fresh 52-week low.
- The stock remains below its 50-day SMA, reflecting persistent technical weakness.
- High promoter share encumbrance continues to remain a key concern for investors.
Overview
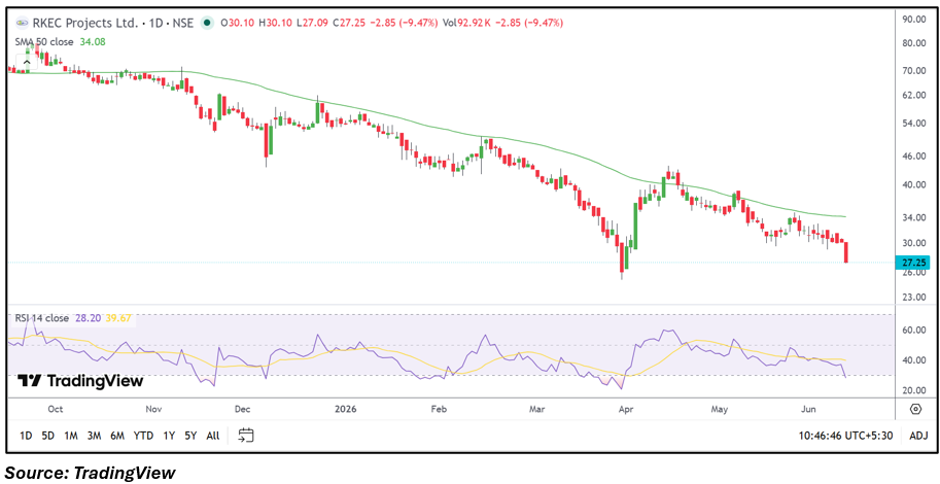
RKEC Projects (NSE: RKEC) came under heavy selling pressure on June 11, with the stock falling 9.47% to ₹27.25 after touching an intraday low of ₹27.09. The decline pushed the stock to a fresh 52-week low and placed it among the session's top losers. Trading activity remained elevated as investors reacted to the continued weak price structure and broader concerns surrounding the stock.
Fundamental View
For the quarter ended December 2025, RKEC Projects reported standalone total income of ₹3,465.25 lakh. Profit before tax stood at ₹236.25 lakh, while net profit came in at ₹170.98 lakh. Earnings per share were reported at ₹0.67. While the company remained profitable during the reported period, market sentiment has remained focused on stock-specific factors rather than earnings performance.
Technical View
RKEC Projects is trading at ₹27.25, significantly below its 50-day SMA of ₹34.08, indicating a sustained bearish trend. The stock has been forming lower highs and lower lows for several months and recently slipped to a fresh 52-week low. The current price structure suggests that sellers continue to dominate the near-term trend.
Momentum Indicator
The 14-day RSI stands at 28.20, placing the stock in the oversold zone. While such readings can occasionally lead to short-term rebounds, they also highlight the intensity of the recent selling pressure.
Key Technical Levels
RKEC Projects has immediate support near ₹27.00, while the next downside zone is placed around ₹25.00. On the upside, resistance is visible near ₹30.10, and a sustained recovery above this level could improve short-term sentiment. A stronger hurdle remains near the 50-day SMA region around ₹34.08.
Key Risks to Watch
- High promoter share encumbrance remains a concern.
- Continued weakness below the 50-day SMA.
- Low investor confidence after fresh 52-week lows.
- Elevated volatility in small-cap infrastructure stocks.
Summary
RKEC Projects emerged among the day's major losers after falling nearly 10% and touching a fresh 52-week low. Despite reporting profits in its latest available quarterly results, the stock continues to face technical weakness and concerns linked to high promoter share encumbrance. Investors may closely watch whether the stock can stabilize near current levels or if selling pressure persists.
FAQs
Why did RKEC Projects shares fall today?
The stock declined nearly 10% amid persistent technical weakness and fresh 52-week low formation.
What does the current chart structure indicate?
The stock remains in a downtrend, trading below its 50-day SMA and forming lower highs and lower lows.
What is a key risk investor should monitor?
High promoter share encumbrance remains an important factor that investors may continue to track.