
Highlights
- Suratwwala Business Group stock declined sharply during March 30, 2026 session.
- Price approached 52-week low with high volatility and wide trading range.
- Exchange indicators flagged low trading participation in recent sessions.
Suratwwala Business Group (NSE:SBGLP) witnessed a notable decline on March 30, 2026. The stock traded at ₹ 19.46, down ₹ 2.86 or 12.81%. The stock opened at ₹ 22.70 and touched a high of ₹ 23.21 before falling to a low of ₹ 18.60, which also marks its 52-week low. The previous closing price stood at ₹ 22.32, while VWAP was recorded at ₹ 19.76.
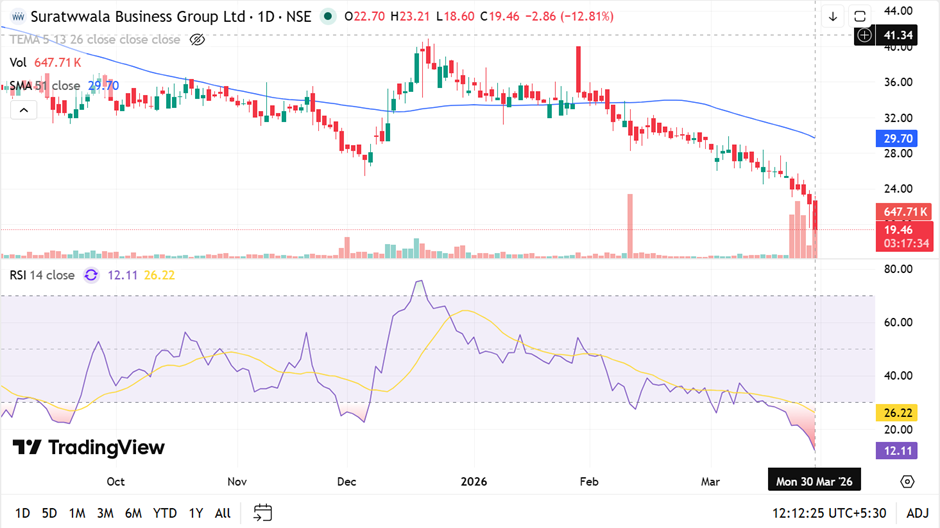
Source: TradingView
Volatility and Trading Indicators
The stock has shown elevated volatility, with daily volatility at 2.95 and annualised volatility at 56.36. The price band is set at 20%, with an upper band of ₹ 26.78 and a lower band of ₹ 17.86.
Exchange data indicates that fewer than 100 unique PAN holders traded in the stock over the past 30 days, suggesting limited participation. Additionally, the stock has witnessed a high-low price variation of more than 75% over the past three months.
Financial Performance Snapshot
For the quarter ended December 31, 2025, the company reported total income of ₹ 4,223.43 lakh on a consolidated basis.
Profit before tax stood at ₹ 1,510.17 lakh, while net profit was reported at ₹ 1,113.11 lakh. Earnings per share (EPS) for the quarter was ₹ 0.62. The financial results were disclosed on February 12, 2026.
Earnings and Market Context
Despite reporting profitability, the stock has shown sharp price fluctuations. The gap between financial performance and market activity reflects variations in trading participation and volatility.
The movement toward the lower end of its 52-week range highlights recent price trends within the broader trading cycle.
Price Trend Overview
The current price is significantly below the 52-week high of ₹ 48.73 recorded on June 13, 2025. The decline toward the 52-week low reflects a wide price band over the past year. Defined circuit limits and volatility indicators continue to shape trading behavior in the stock.
Key Risks
- Low trading participation may impact liquidity and price discovery.
- High volatility may result in sharp short-term price movements.
- Price near 52-week low reflects sustained downward trend.
Summary
Suratwwala Business Group Limited recorded a sharp decline on March 30, 2026, with the stock nearing its 52-week low of ₹ 18.60. The company reported ₹ 1,113.11 lakh net profit on ₹ 4,223.43 lakh total income for Q3 FY26. Exchange indicators highlight low trading participation and high volatility, contributing to recent price movement.
FAQs
- What is the latest stock price movement of Suratwwala Business Group?
The stock declined 12.81% on March 30, 2026, trading at ₹ 19.46 during the session. - What are the recent financial results of the company?
The company reported ₹ 1,113.11 lakh net profit on ₹ 4,223.43 lakh income in Q3 FY26. - Why is the stock considered illiquid?
Fewer than 100 unique PAN holders traded in the stock over the past 30 days.