
Highlights
- V-Mart Retail (NSE: VMART) climbed 11.69% in Thursday’s session.
- December quarter net profit stood at INR 8,799.00 lakh.
- The stock rebounded sharply after testing recent lows.
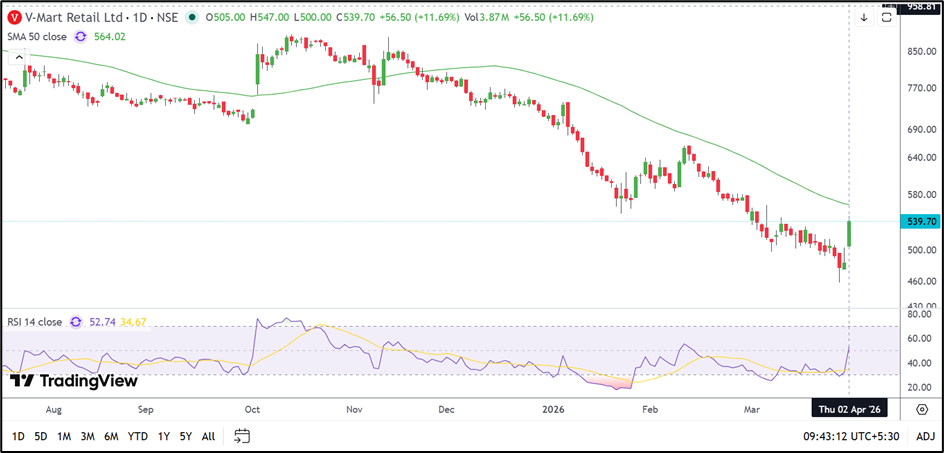
V-Mart Retail (NSE: VMART) moved sharply higher on 2 April 2026, with the stock trading near INR 539.70, up 11.69% from its previous close of INR 483.20. The stock opened at INR 505.00 and touched an intraday high of INR 547.00, while the day’s low stood at INR 500.00. VWAP for the session was recorded at INR 537.71.
The latest rise placed V-Mart Retail (NSE: VMART) among the top gainers of the day after the stock rebounded from its recent low near INR 470.00. Despite the recovery, the stock continues to remain below its 50-day Simple Moving Average near INR 564.02, suggesting that the broader structure is yet to fully improve.
Fundamental View: December Quarter Earnings Remain Supportive
For the quarter ended 31 December 2025, V-Mart Retail (NSE: VMART) reported standalone total income of INR 1,13,034.00 lakh. Profit before tax stood at INR 11,291.00 lakh, while net profit came in at INR 8,799.00 lakh. Earnings per share for the quarter was reported at INR 11.08.
The latest quarterly numbers indicate that the company remained profitable during the quarter. However, the recent decline in the stock before Thursday’s rebound suggests that investors continue to monitor demand trends and retail sector sentiment.
Technical View: Sharp Rebound Emerges After Prolonged Weakness
V-Mart Retail (NSE: VMART) is currently trading near INR 539.70 and remains below its 50-day Simple Moving Average near INR 564.02. The chart had been reflecting a prolonged downtrend through the past few months, with lower highs and lower lows dominating price action.
The latest move indicates that the stock has rebounded from the lower end of its recent range after briefly slipping below INR 500.00. The rebound has pushed the RSI back above the neutral 52.74 mark, suggesting that downside pressure has eased in the near term. Even so, the stock is still trading below its 50-day average, indicating that the recovery remains at an early stage.
Key Technical Levels
At INR 539.70, immediate support is seen near INR 490.00, followed by stronger downside support around INR 450.00. On the upside, resistance is placed near INR 590.00–650.00.
A move above INR 590.00 may improve the short-term outlook, while failure to hold above INR 490.00 could bring the recent lows back into focus.
Source: TradingView
Key Risks
- Failure to hold above INR 490.00 may weaken the rebound.
- Resistance near INR 590.00–650.00 may restrict recovery.
- Weak retail sector sentiment may pressure the stock.
- The stock remains below its 50-day moving average.
Summary
V-Mart Retail (NSE: VMART) shares rose 11.69% to INR 539.70 after rebounding from recent lows. Although the stock remains below its 50-day moving average near INR 564.02, RSI has improved above 50. Investors are likely to monitor whether the stock can sustain above INR 490.00 and challenge resistance near INR 590.00.
FAQs
- Why did V-Mart Retail shares rise today?
The stock rebounded sharply after recovering from recent lows. - What was V-Mart Retail’s December quarter net profit?
The company reported standalone net profit of INR 8,799.00 lakh. - Which levels are important for V-Mart Retail shares?
Support is near INR 490.00–450.00, while resistance is around INR 590.00–650.00.