
Highlights
- We Win shares surged nearly 17% with strong expansion in trading volumes.
- Stock crossed above key breakout levels and moved near fresh multi-week highs.
- RSI entered elevated territory as momentum accelerated sharply during the rally.
Overview
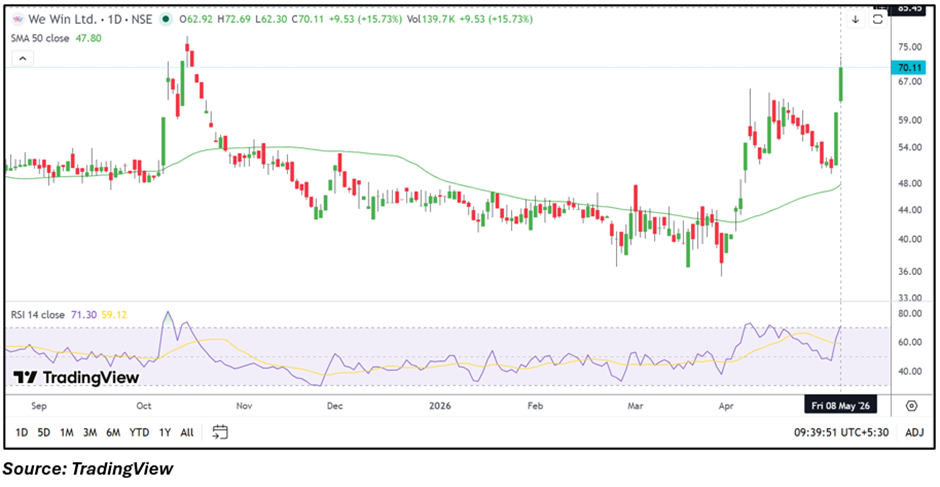
We Win (NSE: WEWIN) jumped 16.80% on May 8, 2026, touching an intraday high of ₹72.69 during strong momentum-led trading activity. The stock opened at ₹62.92 against the previous close of ₹60.58 and emerged among the top gainers in the session.
The sharp rally pushed the stock decisively above its 50-day simple moving average near ₹47.80, improving the near-term technical structure after a prolonged consolidation phase visible over previous month. Trading volumes also expanded significantly alongside the breakout move.
Fundamental View
For the quarter ended December 31, 2025, We Win reported consolidated total income of INR 2,189.61 lakh. Profit before tax stood at INR 116.14 lakh, while net profit came at INR 117.30 lakh. Earnings per share for the quarter was reported at INR 0.85.
Market participants continue monitoring demand trends in the financial services and business process management segment, along with operational scalability, client additions, and earnings consistency.
Technical View
We Win is trading near ₹70.76, up 16.80%, and remains firmly above its 50-day SMA around ₹47.80, indicating a significantly improved near-term setup. Price action reflects a decisive breakout move after the stock consolidated around the ₹40–₹60 range for several weeks.
The 14-day RSI has climbed near 71.30, suggesting momentum has strengthened sharply and entered elevated territory following the breakout. The stock also witnessed a notable rise in volatility as prices moved above the ₹70 zone.
Momentum Indicator
The RSI has crossed above the 70 level, indicating accelerated momentum conditions after the sharp rally. Elevated RSI readings may also keep short-term price swings active near higher resistance levels.
Key Technical Levels
- Immediate Support: ₹65.00
- Secondary Support: ₹61.00
- Immediate Resistance: ₹76.00
- Higher Resistance: ₹80.00
Risks To Watch
- Elevated RSI may trigger short-term profit booking.
- Sharp volatility can increase near resistance levels.
- Sustaining momentum above ₹65 remains technically important.
- Low liquidity may amplify price swings in volatile sessions.
Summary
We Win shares rallied sharply as strong momentum and increased trading activity pushed the stock into a breakout zone above key technical levels. The move strengthened the short-term structure and lifted RSI into elevated territory. Traders may continue monitoring resistance near ₹76–₹80 and support stability around ₹65 for further directional cues.
FAQs
Why did We Win shares surge sharply today?
The stock rallied after witnessing strong momentum-driven buying activity and a breakout above key technical levels.
What are the important support levels for WEWIN?
Immediate support is placed near ₹65, while the next important support zone is around ₹61.
Why is RSI important for We Win currently?
RSI above 71 indicates elevated momentum and suggests the stock may remain volatile in the near term.