
Highlights
- Wonder Electricals shares declined 8.05% during Wednesday’s trading session.
- December quarter consolidated net profit stood at INR 56.57 lakh.
- The stock slipped sharply after breaking below recent support.
Wonder Electricals (NSE: WEL) declined on 1 April 2026, with the stock trading near INR 88.22, down 8.05% from its previous close of INR 95.94. The stock opened at INR 95.09 and touched an intraday high of INR 108.50 before falling sharply to a low of INR 79.80. VWAP for the session was recorded at INR 94.39.
The latest decline came after the stock failed to sustain above the INR 95.00 zone. Wonder Electricals (NSE: WEL) also continues to trade with a price-to-earnings ratio above 50.00 based on the previous four trailing quarters.
Fundamental View: December Quarter Profit Stays Limited
For the quarter ended 31 December 2025, Wonder Electricals reported consolidated total income of INR 15,255.83 lakh. Profit before tax stood at INR 78.35 lakh, while net profit came in at INR 56.57 lakh. Earnings per share for the quarter was reported at INR 0.04.
Although the company remained profitable during the quarter, earnings stayed modest compared with the recent movement in the share price. Investors may continue to track whether the company can improve profitability in coming quarters.
Technical View: Sharp Breakdown Pushes Stock into Correction
Wonder Electricals is currently trading near INR 88.22 and remains well below its 50-day Simple Moving Average near INR 137.49. The latest price action suggests that the stock has entered a deeper correction phase after breaking below the INR 95.00 level.
The recent fall has pushed the stock toward the lower end of its recent range, while the sharp intraday decline indicates that selling pressure has accelerated. The broader structure now reflects a sequence of lower highs and lower lows.
Momentum Indicator Turns Deeply Weak
The 14-day RSI has dropped to around 12.82, indicating that the stock has moved into deeply oversold territory. While this may support temporary stabilisation, momentum remains extremely weak.
Key Technical Levels
At INR 88.22, immediate support is seen near INR 79.00, followed by stronger downside support around INR 72.00. On the upside, resistance is placed near INR 95.00–102.00.
A move back above INR 95.00 may ease some of the recent pressure, while failure to hold above INR 79.00 could keep the correction intact.
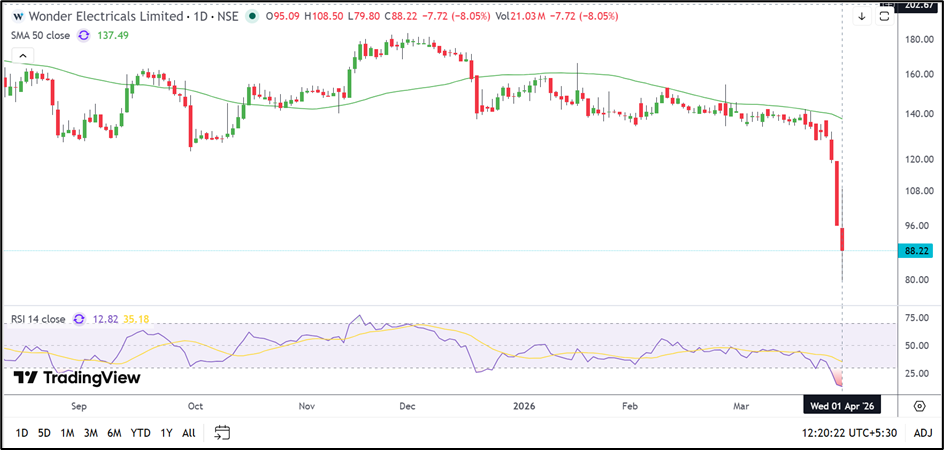
Source: TradingView
Key Risks
- Failure to hold above INR 79.00 may deepen the decline.
- Resistance near INR 95.00–102.00 may restrict recovery.
- Elevated valuation may keep volatility high.
- Weak momentum may continue below the 50-day average.
Summary
Wonder Electricals shares declined 8.05% to INR 88.22 after slipping below INR 95.00. The stock remains far below its 50-day moving average near INR 137.49, while RSI near 12.82 indicates deeply weak momentum. Investors are likely to watch whether support near INR 79.00 can hold.
FAQs
- Why did Wonder Electricals shares fall today?
The stock declined after breaking below the INR 95.00 support zone. - What was Wonder Electricals’ December quarter net profit?
The company reported consolidated net profit of INR 56.57 lakh. - Which levels are important for Wonder Electricals shares now?
Support is near INR 79.00–72.00, while resistance stands near INR 95.00–102.00.