
Highlights
- Bank of India (NSE: BANKINDIA) slipped 3.22% to INR 138.45.
- The stock is trading below its 50-day SMA of INR 159.05.
- December 2025 quarter net profit came in at INR 2,75,001.00 lakh.
Bank of India (NSE: BANKINDIA) remained under pressure on 7 April 2026, with the stock declining 3.22% to INR 138.45. The stock opened at INR 142.05 and failed to hold early gains, touching an intraday low of INR 137.73. The session high also remained limited to INR 142.05, while VWAP stood at INR 138.56.
The latest weakness has extended the corrective move that started after the stock failed to sustain near the INR 175 zone in March. Bank of India (NSE: BANKINDIA) is now trading notably below its 50-day Simple Moving Average near INR 159.05, reflecting that near-term sentiment has turned weaker.
Fundamental View
For the quarter ended 31 December 2025, Bank of India (NSE: BANKINDIA) reported consolidated total income of INR 21,37,921.00 lakh. Profit before tax stood at INR 3,67,352.00 lakh, while net profit was reported at INR 2,75,001.00 lakh. Earnings per share for the quarter came in at INR 6.18.
The quarterly performance indicates that Bank of India (NSE: BANKINDIA) continues to post healthy profitability despite the recent correction in the stock price. Strong earnings and stable profitability may continue to provide long-term support, although the broader market weakness in PSU banking stocks has kept the share under pressure in the short term.
Technical View
Bank of India (NSE: BANKINDIA) is currently trading near INR 138.45 and remains below its 50-day Simple Moving Average of INR 159.05. The recent chart structure shows that the stock has broken below the earlier support zone near INR 145 and has continued to make lower highs over the past few sessions.
The 14-day RSI is near 37.86, which suggests that momentum remains weak but is not yet deeply oversold. This means the stock may still face additional downside pressure before a stronger rebound emerges.
The latest decline also indicates that buyers have not yet regained control. Unless Bank of India (NSE: BANKINDIA) manages to move back above INR 150, the current trend is likely to remain negative. Any short-term recovery toward higher levels may continue to face selling pressure.
Key Technical Levels
Immediate support for Bank of India (NSE: BANKINDIA) is placed near INR 128.00. If this level breaks, the next important downside zone is around INR 120.00.
On the upside, the first major resistance is seen near INR 150.00. A stronger hurdle is placed near INR 160.00, which also coincides closely with the 50-day moving average.
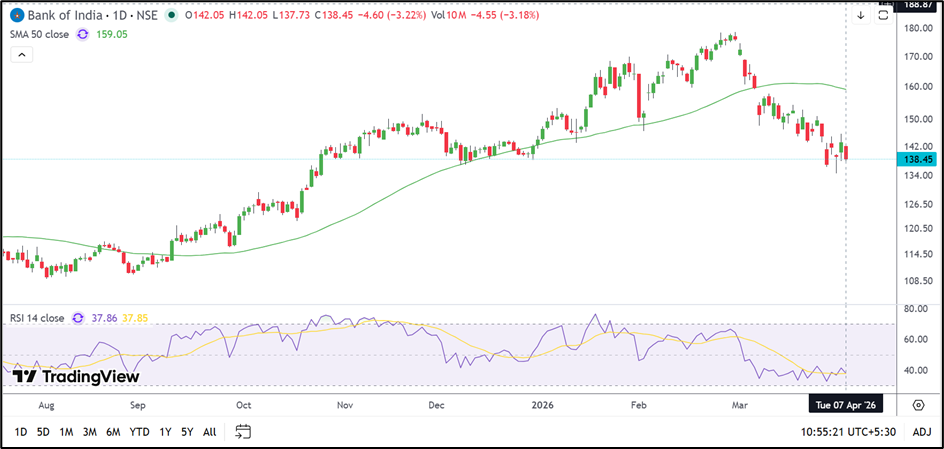
Source: TradingView
Risks To Watch
- Sustained trade below INR 145 may keep the trend weak.
- A break below INR 128 could open the way toward INR 120.
- Resistance near INR 150–160 may cap any rebound.
- Broader weakness in PSU bank stocks may continue to affect sentiment.
Summary
Bank of India (NSE: BANKINDIA) has entered a weaker phase after slipping below key support levels and its 50-day moving average. Although the company’s December 2025 earnings remained strong, the technical structure currently favours caution. Support is seen at INR 128–120, while resistance remains at INR 150–160.
FAQs
- Why did Bank of India (NSE: BANKINDIA) fall today?
The stock fell after failing to hold above the INR 145 zone and remains below its 50-day moving average. - What was Bank of India’s net profit in the December 2025 quarter?
Bank of India (NSE: BANKINDIA) reported consolidated net profit of INR 2,75,001.00 lakh. - What are the important support and resistance levels for Bank of India (NSE: BANKINDIA)?
Support is placed near INR 128.00–120.00, while resistance remains near INR 150.00–160.00.