
Highlights
- Emkay Global Financial Services shares gained over 10% in intraday trade.
- The stock moved above its 21-day SMA with a sharp bullish candle.
- RSI crossed into elevated territory, reflecting improving momentum conditions.
Overview
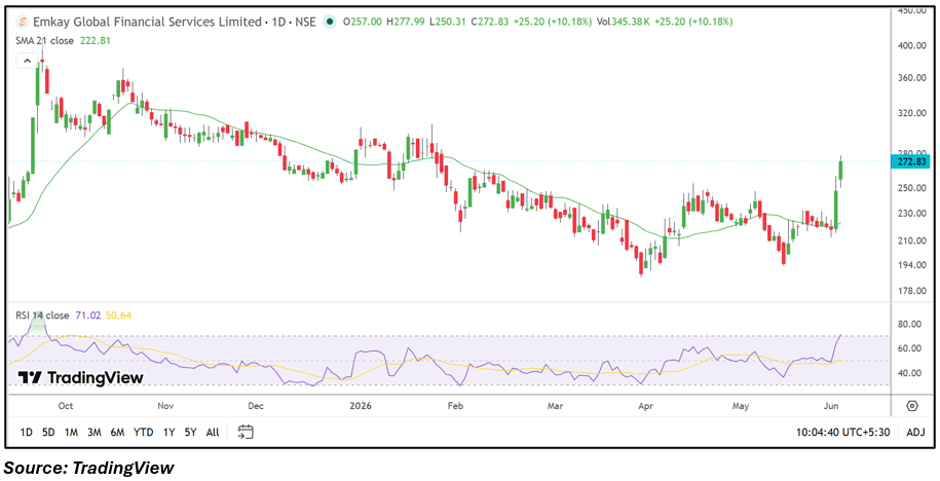
Emkay Global Financial Services (NSE: EMKAY) emerged among the top gainers after the stock climbed 10.18% to INR 272.83 on June 3. The move came alongside increased trading activity and pushed the stock to its highest level in several trading sessions. The rally has attracted attention from market participants as the stock attempts to break out of its recent consolidation range.
Fundamental View
For the quarter ended March 2026, the company reported consolidated total income of INR 15,320.32 lakh. Profit before tax stood at INR 960.04 lakh, while net profit came in at INR 565.69 lakh. Earnings per share were reported at INR 2.20.
The latest financial performance indicates the company remained profitable during the quarter, although investors may continue monitoring earnings consistency and capital market activity trends that can influence financial services businesses.
Technical View
EMKAY is currently trading at INR 272.83, significantly above its 21-day SMA of INR 222.81, indicating an improving near-term technical structure. The stock has broken out of a consolidation zone that persisted through recent sessions and formed a wide bullish candle.
The 14-day RSI stands near 71.02, moving into the overbought region. While this reflects strong upward momentum, it also suggests traders may watch for short-term volatility after the sharp advance.
Momentum Indicator
Momentum has strengthened considerably as the RSI surged above the 70 mark. The indicator reflects renewed upside participation following a prolonged sideways phase. Sustaining levels above the 21-day SMA may remain important for maintaining the current positive price structure.
Key Technical Levels
On the downside, immediate support is placed near INR 259.19, followed by a stronger support zone around INR 245.55. These levels could act as important areas to monitor if profit booking emerges.
On the upside, the first resistance is located near INR 286.47. A sustained move above this level may open the door toward the next resistance zone around INR 300.11.
Risks to Watch
- Volatility may increase as RSI enters overbought territory.
- Sharp rallies can trigger short-term profit booking.
- Weak capital market sentiment may impact financial stocks.
- Lower trading volumes could increase price fluctuations.
Summary
Emkay Global Financial Services (NSE: EMKAY) advanced more than 10% and broke above its recent consolidation range while moving decisively above the 21-day SMA. Momentum indicators have strengthened, with RSI entering overbought territory. Support levels are placed near INR 259.19 and INR 245.55, while resistance levels are seen around INR 286.47 and INR 300.11. Traders may watch whether the stock can sustain its breakout momentum in the coming sessions.
FAQs
Why is EMKAY stock rising today?
The stock gained over 10% after a technical breakout from consolidation accompanied by improved momentum indicators.
What is the key support level for EMKAY?
Immediate support is located near INR 259.19, with a secondary support zone around INR 245.55.
Is EMKAY trading above its moving average?
Yes, the stock is trading well above its 21-day SMA, indicating an improved near-term trend.