
Highlights
- Emmbi Industries shares rallied more than 13% with a sharp increase in trading activity.
- The stock broke above recent consolidation levels and reached a multi-month high.
- Strong quarterly profitability and improving earnings supported market sentiment.
Overview
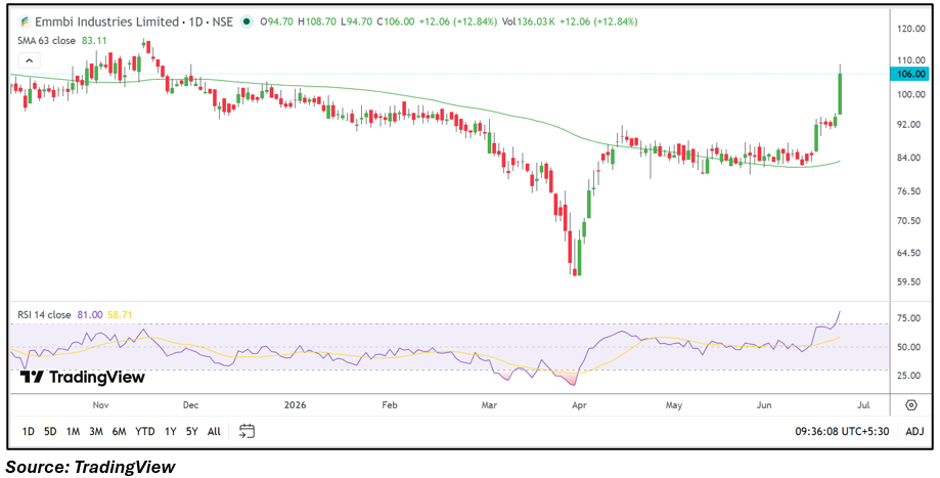
Emmbi Industries Limited (NSE: EMMBI) emerged among the top gainers on June 23, 2026, with the stock rising over 13% to ₹106.42. The rally was accompanied by increased trading volumes and a decisive breakout above its recent consolidation zone. The move pushed the stock to its highest level in several months, drawing attention from market participants following a prolonged period of sideways trading.
The latest price action reflects renewed momentum after the stock spent several weeks consolidating near the ₹84–₹95 range. The breakout has also lifted the share price significantly above its 63-day moving average, highlighting a notable shift in trend strength.
Fundamental View
Emmbi Industries reported consolidated total income of ₹11,712.10 lakh for the quarter ended March 2026. The company posted a profit before tax of ₹333.50 lakh and a net profit of ₹242.60 lakh, while earnings per share stood at ₹1.26.
The return to profitability and stable earnings performance may have contributed to improving sentiment around the stock. Investors also appear to be focusing on the company's ability to maintain positive margins amid evolving industry conditions.
Technical View
Technically, EMMBI has delivered a strong bullish breakout after spending several months in a consolidation phase. The stock surged from the ₹94.70 opening level to an intraday high of ₹108.70 while recording a substantial increase in volume.
Price is now trading comfortably above its medium-term trend indicators, while momentum readings have moved into elevated territory. Although the breakout confirms improving strength, the sharp rise in a single session may also lead to intermittent consolidation as traders assess the sustainability of the move.
Key Technical Levels
The stock is currently trading near ₹106.42 after hitting an intraday high of ₹108.70. Immediate support is seen around ₹100.00, followed by a stronger support zone near ₹94.00. On the upside, resistance may emerge around ₹109.00, while a sustained move above this level could open the path toward the ₹115.00 region.
Risks to Watch
- Sharp rallies may trigger short-term profit booking.
- Low trading participation can increase price volatility.
- Earnings growth may remain sensitive to industry demand.
- Failure to hold breakout levels could weaken momentum.
Summary
Emmbi Industries shares witnessed a sharp breakout on June 23 as the stock gained more than 13% and climbed to a multi-month high. Improved profitability, strong price momentum, and increased trading activity supported the move. Technically, the breakout marks a significant shift from the previous consolidation phase. However, traders may closely watch whether the stock can sustain gains above recent breakout levels amid elevated momentum conditions.
FAQ
- Why did Emmbi Industries shares rise sharply today?
The stock surged after breaking above a prolonged consolidation range, supported by strong momentum and higher trading volumes.
- What were Emmbi Industries' latest quarterly results?
For March 2026, the company reported total income of ₹11,712.10 lakh and net profit of ₹242.60 lakh.
- What are the key levels to watch in EMMBI stock?
Support zones are near ₹100.00 and ₹94.00, while resistance levels are around ₹109.00 and ₹115.00.