
Highlights
- Globe International Carriers shares declined over 6% during Friday's session.
- The stock slipped to fresh multi-month lows amid sustained selling pressure.
- Price remains well below the 50-day SMA while RSI enters oversold territory.
Overview
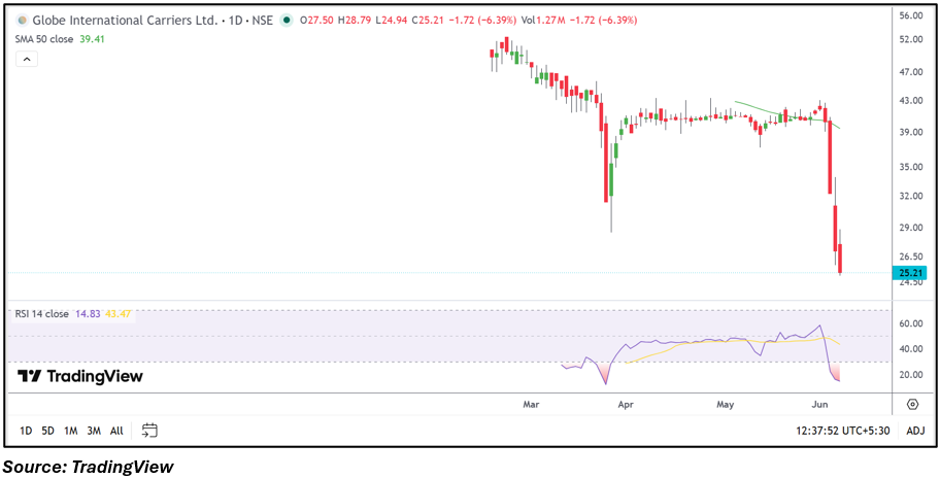
Globe International Carriers Limited (NSE: GICL) came under significant pressure on June 5, with the stock falling 6.39% to ₹25.21. The decline pushed the share price to fresh multi-month lows and extended the ongoing corrective trend visible on the daily chart. The stock traded between ₹24.94 and ₹28.79 during the session, reflecting elevated volatility as sellers maintained control.
Fundamental View
For the quarter ended March 2026, the company reported total income of ₹5,528.59 lakh, while profit before tax stood at ₹347.56 lakh. Net profit came in at ₹238.73 lakh with earnings per share of ₹0.22. While the company remained profitable during the reported quarter, the stock's recent movement suggests that market participants are focusing more on price action and momentum than on the latest earnings figures.
Technical View
GICL is trading substantially below its 50-day Simple Moving Average of ₹39.41, highlighting a weak medium-term technical structure. The chart shows a decisive breakdown from a prolonged consolidation zone near ₹40.00–₹42.00, followed by accelerated downside momentum over recent sessions.
The Relative Strength Index (RSI) has dropped to 14.83, placing it deep in oversold territory. Although such readings can sometimes precede short-term rebounds, the prevailing trend remains negative until the stock begins forming a stable base and reclaims key resistance levels.
Momentum Indicator
The RSI reading of 14.83 reflects extremely weak momentum. Such levels indicate that selling pressure has intensified sharply, though oversold conditions alone do not guarantee an immediate recovery.
Key Technical Levels
Following the recent breakdown, immediate support is placed near ₹24.90, which corresponds to the session low. A sustained breach below this level could expose the stock to the ₹23.00 area. On the upside, the first resistance is located near ₹28.80, the day's high, while a stronger recovery would require the stock to move back above the ₹32.00 zone where previous support had existed before the breakdown.
Risks to Watch
- Continued trading below the 50-day SMA.
- Extremely weak price momentum.
- Failure to hold near current support levels.
- Elevated volatility following the breakdown.
Summary
Globe International Carriers shares remain under pressure after breaking below important support zones and falling to fresh multi-month lows. The stock is trading well below its 50-day SMA, while the RSI has entered oversold territory, reflecting intense selling momentum. Although oversold conditions may trigger short-term rebounds, the broader technical structure remains weak unless the stock can reclaim nearby resistance levels and stabilize above recent support zones.
FAQs
- Why did GICL shares fall today?
The stock declined amid persistent selling pressure and a breakdown below key technical support level. - Is GICL in an oversold zone?
Yes, the RSI is near 14.83, indicating extremely oversold market conditions. - What levels should traders monitor?
Support is near ₹24.90, while resistance is positioned around ₹28.80 and ₹32.00.