
Highlights
- Heads UP Ventures shares jumped more than 14% during Tuesday's session.
- The stock moved above its 50-day SMA after a prolonged consolidation phase.
- Momentum indicators strengthened sharply as buying activity accelerated.
Overview
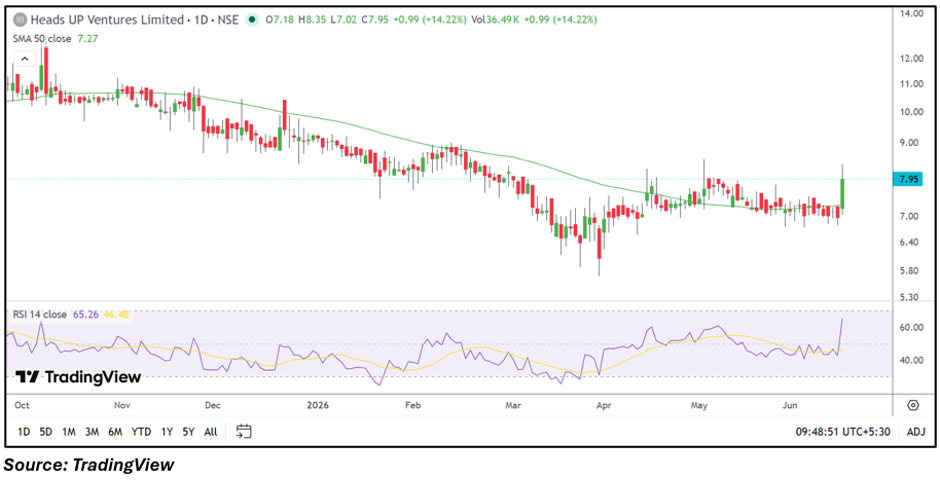
Heads UP Ventures Limited (NSE: HEADSUP) attracted significant investor attention on June 16, 2026, with the stock rising 14.22% to ₹7.95. The rally placed the stock among the top gainers on the NSE, supported by increased trading activity and a technical breakout from recent consolidation levels.
The stock opened at ₹7.18, touched an intraday high of ₹8.35, and maintained strong gains through the session. The move comes after several months of range-bound trading, indicating renewed market interest in the counter.
Fundamental View
For the quarter ended March 2026, Heads UP Ventures reported consolidated total income of INR 280.22 lakh. The company posted a loss before tax of INR 311.08 lakh and a net loss of INR 311.68 lakh. Earnings per share stood at negative INR 1.41.
While the latest quarterly results remained in the red, today's price movement appears largely driven by market sentiment and technical factors rather than any fresh earnings-related trigger.
Technical View
HEADSUP is currently trading at ₹7.95, significantly above its 50-day SMA of ₹7.27. The breakout above this moving average is noteworthy because the stock had spent several months trading below or around this level.
The chart suggests that buyers stepped in aggressively near recent support zones, pushing the stock above the consolidation band that had contained prices for several weeks. The sharp rise in price and volume indicates improving short-term sentiment, although volatility remains elevated due to the stock's relatively low trading participation.
Momentum Indicator
The RSI (14) has climbed to around 65.26, reflecting strengthening momentum. The indicator has moved well above its signal line and is approaching the overbought zone, highlighting increased buying interest during the session.
Key Technical Levels
Technically, immediate support is seen around ₹7.55, followed by a stronger support zone near ₹7.20. On the upside, resistance may emerge around ₹8.35, which coincides with today's intraday high. A sustained move above this level could open the path toward the ₹8.75 zone, while failure to hold above the 50-day SMA may result in renewed consolidation.
Risks to Watch
- The company reported a net loss in the latest quarter.
- Low trading participation can increase volatility.
- Sharp rallies may attract profit-booking activity.
- Breakout sustainability remains unconfirmed.
Summary
Heads UP Ventures surged more than 14% on June 16, driven primarily by technical strength and renewed buying interest. The stock moved above its 50-day SMA after a lengthy consolidation period, while momentum indicators improved significantly. Despite the strong price action, investors may continue monitoring whether the breakout sustains, especially given the company's recent loss-making financial performance and the stock's history of volatility.
FAQs
- Why did Heads UP Ventures rise more than 14% today?
The rally appears driven by a technical breakout above recent consolidation levels and increased buying activity.
- Is HEADSUP trading above its 50-day SMA?
Yes, the stock is trading above its 50-day SMA of ₹7.27.
- What is the key resistance level for HEADSUP?
The immediate resistance zone is near ₹8.35, which marks today's intraday high.