
Highlights
- Kross shares surged more than 13% and crossed the ₹220 mark during intraday trade.
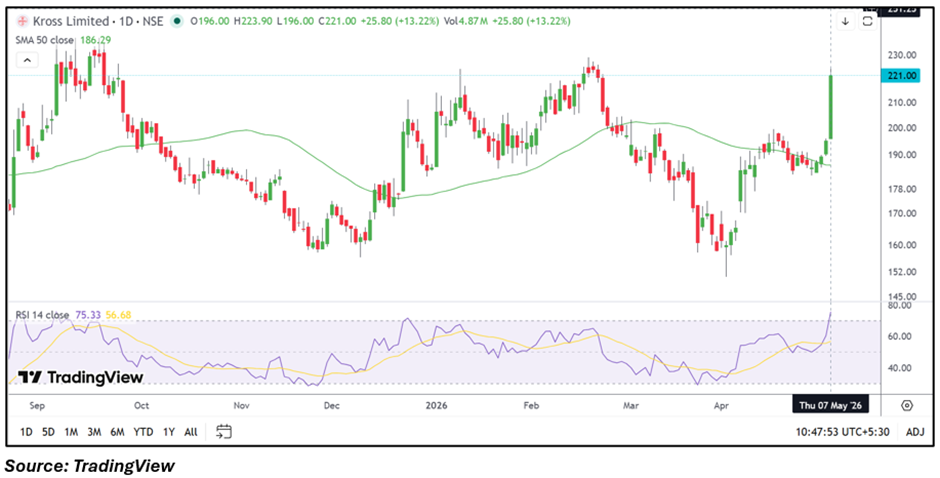
- Stock moved decisively above its 50-day SMA with momentum indicators turning elevated.
- RSI climbed above 75 as price action approached fresh short-term breakout levels.
Overview
Kross (NSE: KROSS) gained 13.22% on May 7, 2026, touching an intraday high of ₹223.90 amid strong momentum-led activity in the broader market. The stock opened at ₹196.00 against the previous close of ₹195.20 and remained among the top gainers during the session.
The rally pushed the stock firmly above its 50-day simple moving average near ₹186.29, improving the near-term technical structure after a recovery from lower levels seen in recent weeks. Trading volumes also expanded notably alongside the sharp upward move.
Fundamental View
For the quarter ended December 31, 2025, Kross reported standalone total income of INR 17,775.20 lakh. Profit before tax stood at INR 1,928.10 lakh, while net profit came at INR 1,398.10 lakh. Earnings per share for the quarter was reported at INR 2.17.
Market participants continue monitoring demand trends across commercial vehicle components, infrastructure-linked activity, raw material costs, and execution visibility within the company’s manufacturing operations.
Technical View
Kross is trading near ₹221.00, up 13.22%, and remains above its 50-day SMA around ₹186.29, indicating an improved near-term setup. Price action reflects a strong breakout move after a consolidation phase visible across recent weeks.
The 14-day RSI has climbed near 75.33, suggesting momentum has strengthened sharply following the latest rally. The stock also approached fresh short-term highs as volatility expanded during the session.
Momentum Indicator
The RSI has crossed above the 75 level, indicating elevated momentum conditions. While the current structure remains supportive, higher RSI readings may also increase the possibility of short-term volatility near resistance zones.
Key Technical Levels
- Immediate Support: ₹205.00
- Secondary Support: ₹195.00
- Immediate Resistance: ₹240.00
- Higher Resistance: ₹260.00
Risks To Watch
- Elevated RSI may lead to short-term price swings.
- Raw material cost fluctuations can impact margins.
- Weak commercial vehicle demand may affect revenue growth.
- Sustaining momentum above ₹205 remains technically important.
Summary
Kross shares rallied sharply as the stock witnessed strong momentum above key technical levels and moved firmly above its 50-day SMA. The breakout improved the near-term technical structure, while RSI readings entered elevated territory following the sharp rise. Traders may continue monitoring resistance near ₹240–₹260 and support stability around ₹205 in the near term.
FAQs
Why did Kross shares rise sharply today?
The stock gained after witnessing strong momentum-driven trading activity and a breakout above important technical levels.
What are the important support levels for KROSS?
Immediate support is placed near ₹205, while the next key support zone is around ₹195.
Why is RSI important for Kross currently?
RSI near 75 indicates elevated momentum and suggests the stock may remain volatile in the near term.